After a long season that had plenty of twists and turns, we’ve arrived at the NBA Finals. On Thursday, the two-time defending champion Golden State Warriors will take on the Toronto Raptors in a matchup that hopefully has a bit more drama than last year’s four-game Finals sweep to end the year.
We already know what happened on the court. But what happened off the court as the NBA Playoffs were heating up? Below, we share some insights from iSpot, CreatorIQ, Inscape and Tubular Labs.
From the start of the first round on April 13, through the end of the conference finals on May 25, the NBA Playoffs generated 29.5 billion ad impressions on an estimated TV spend of $624.9 million, according to TV ad measurement and attribution company iSpot.tv. Top brand advertisers for the playoffs to this point have included Progressive (estimated $18.1 million), AT&T Wireless ($17.6M), Kia ($16.1M), Corona Extra ($16M) and Burger King ($15.1M). In total, 15 different brands have spent at least $10 million on NBA Playoffs advertising so far.


While the brands above represented the largest estimated spend, they only made up a small fraction of that near-$625 million total. But across brand categories, it’s obvious a few own a sizeable share of the ad conversation. Just five categories — quick serve restaurants, automakers, beer, insurance and wireless companies — made up 43.2% of the entire TV ad spend.
Of course, the NBA players themselves are a huge draw for fans excited to see how their favorite basketball stars will perform under pressure — so we examined audience demographics for two key players of the tournament using insights from CreatorIQ, influencer marketing software that helps companies run brand ambassador campaigns with content creators.
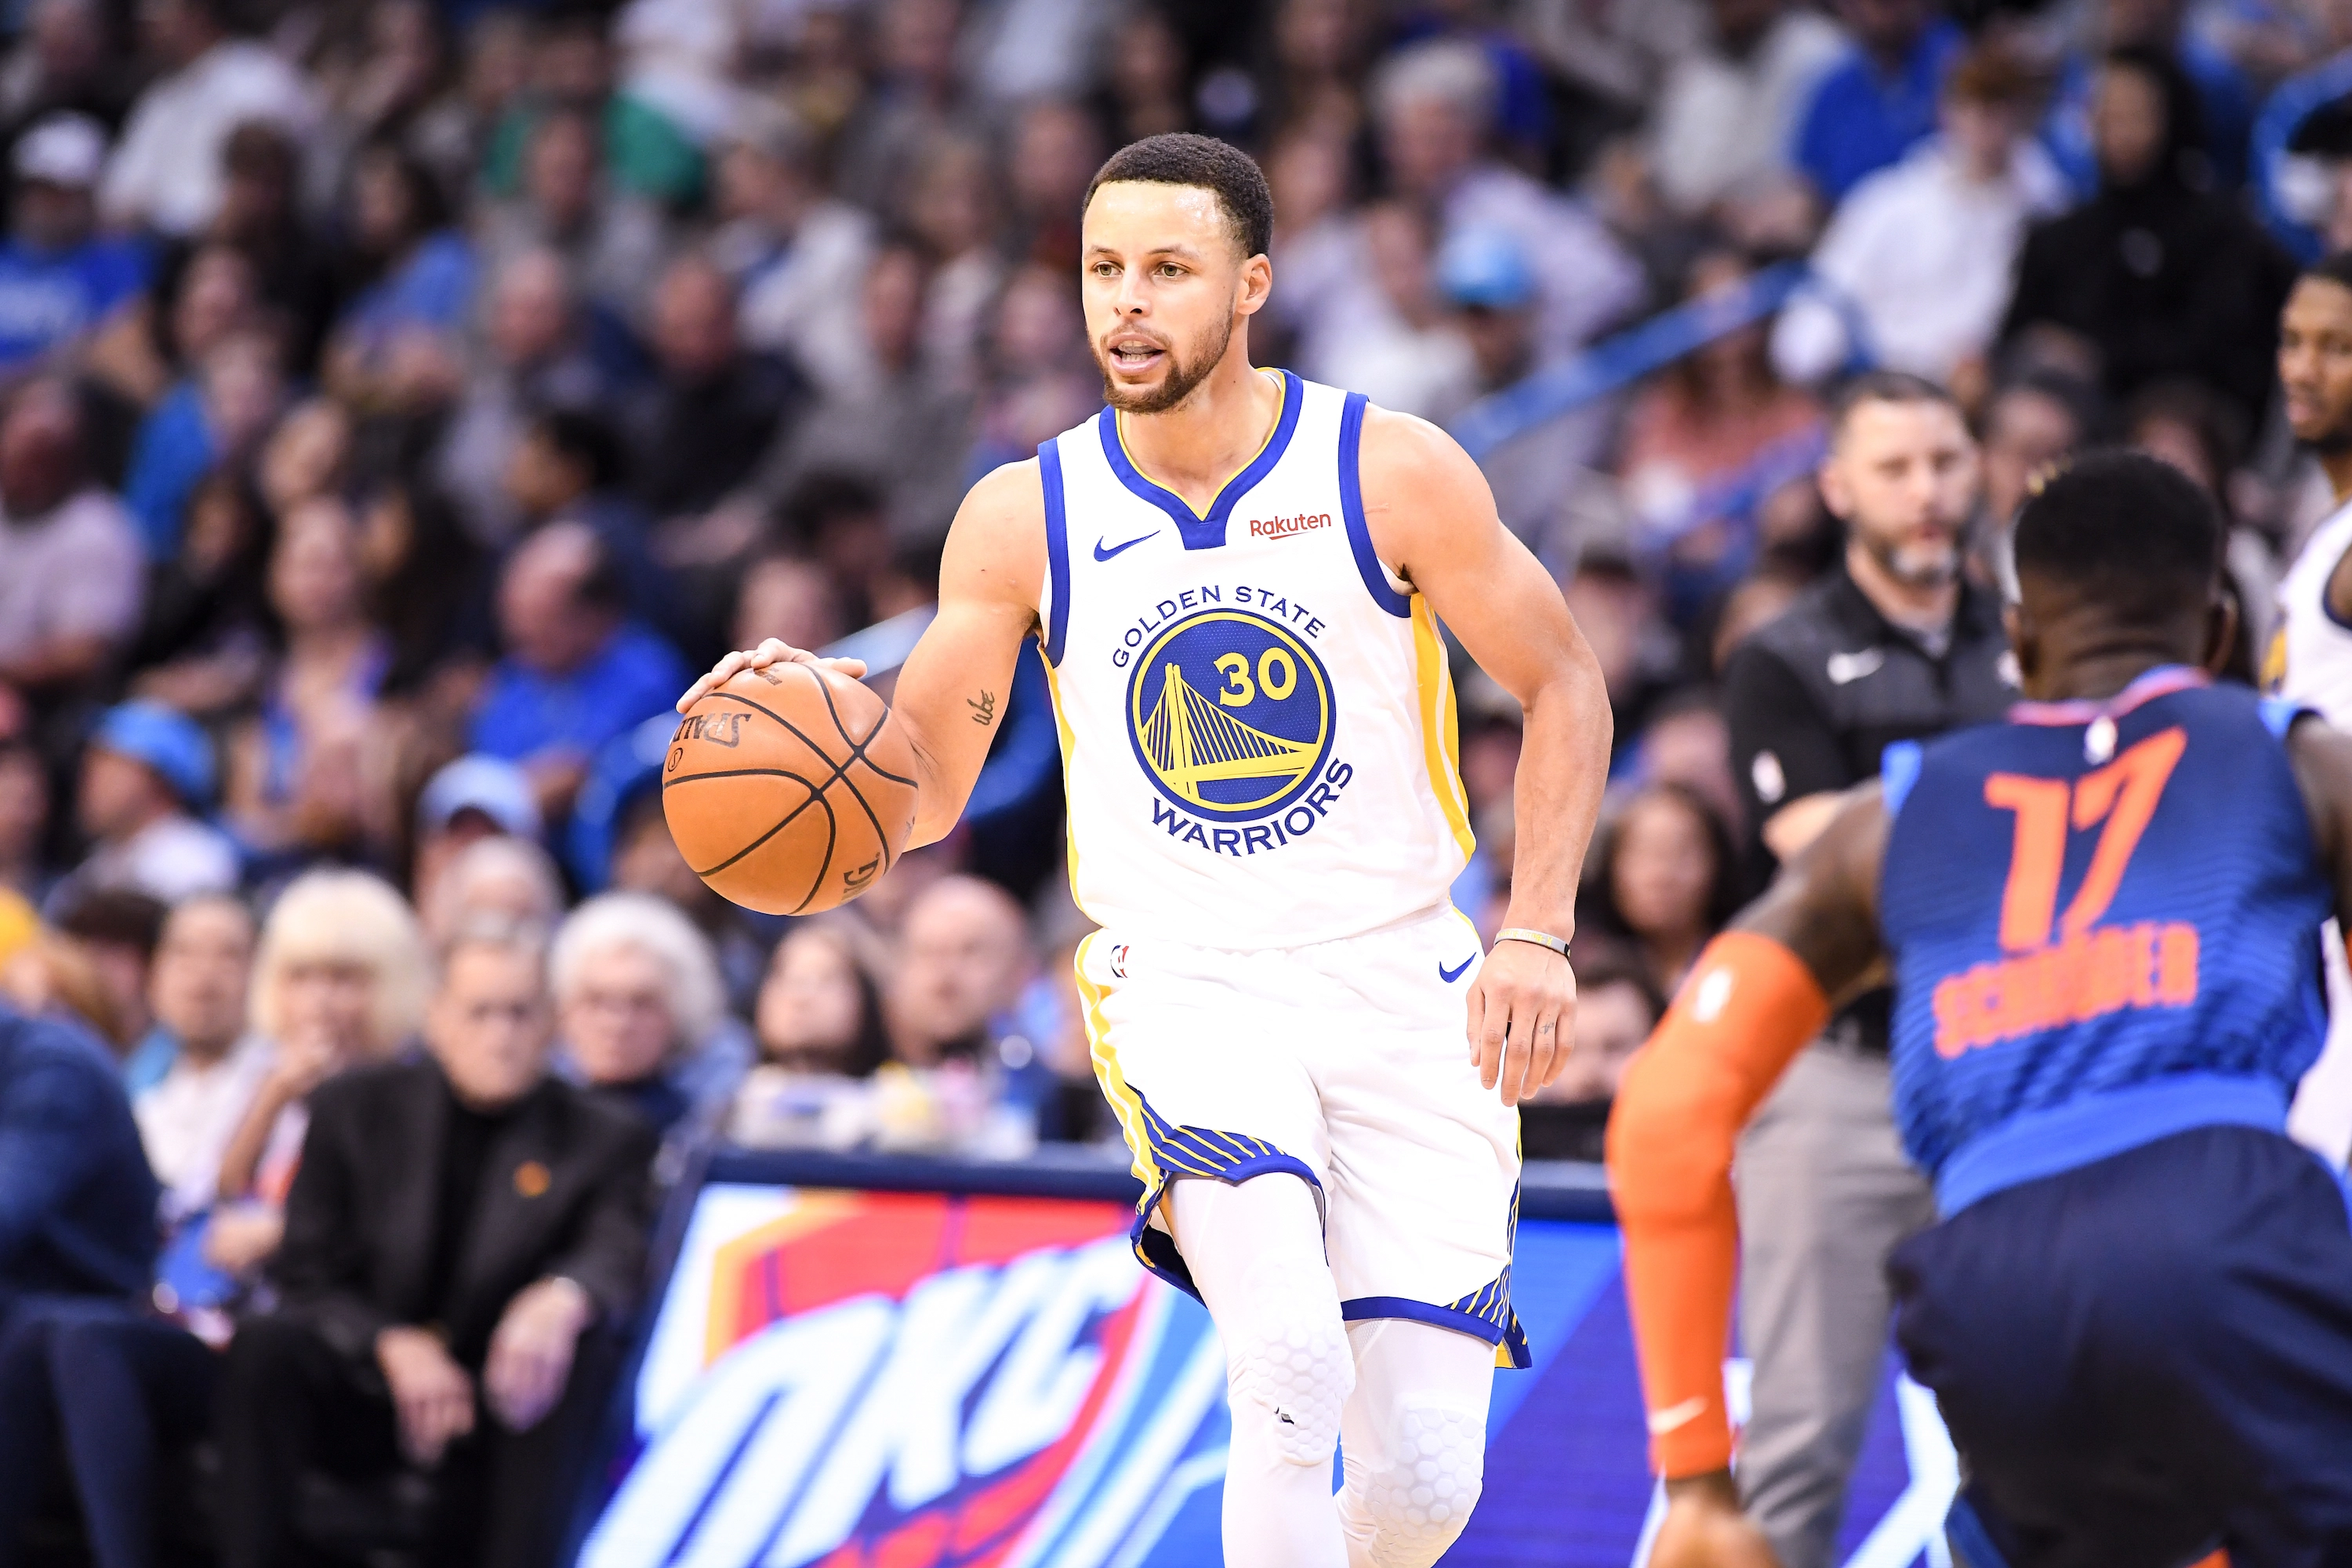
Stephen Curry (Golden State Warriors)
Whether you love or hate him, there’s no denying that Steph Curry is an NBA star, and he has the followers to prove it. Although his biggest audience is on Instagram (25.4 million followers, average engagement rate of 2.55%), his YouTube channel has a higher engagement rate (645.8K subscribers, 2.7% engagement rate). Curry’s overall audience across social platforms is 65% male, and 73% of fans are from the U.S. The largest age demographic is 18-24 years old.

As the celebrity that he is, there’s no surprise that Curry often works with brands. Recently, he did sponsored posts for Infiniti:
Giannis Antetokounmpo (Milwaukee Bucks)
While he may not be quite as well-known as Curry, Giannis Antetokounmpo has been a solid player for Milwaukee and really broke out this season. His largest audience is on Instagram (4.9 million followers, average engagement rate of 5.46%) and the overall audience across social platforms is 88% male, with 74% of fans from the U.S. The age breakdown of followers is tied at 24% for the under-18 crowd and the 18-24 year old group.

Antetokounmpo has also done brand partnerships; recently he promoted JBL Audio headphones on his social channels:
Drake (Raptors’ Ambassador)
For good measure, we also took a look at Canadian rapper Drake, the Raptors’ “global ambassador.” His biggest social audience is on Instagram, with 53.3 million followers and an average engagement rate of 2.37%, according to CreatorIQ. Drake’s audience gender breakdown is a bit more even than the NBA players’, although males still dominate (53%). Although Drake comes from Canada, only 2% of his audience is from there, while 80% is U.S.-based.

Speaking of social media, the NBA’s video presence extends well beyond TV and into digital. Using data from Tubular Labs, we were able to measure how NBA social video content has been performing since the start of the Playoffs, and which content creators were really owning the conversation across platforms like YouTube, Facebook, Twitter and Instagram.

As you’ll notice above, NBA-related video content has risen pretty steadily throughout the Playoffs, peaking during the Conference Finals — and likely to trend back up as the Finals get started. In the early rounds, NBA social videos were averaging around 50 million views per day, and that number has trended closer to 75 million on average since the second round began.
Ximo Pierto, an NBA highlight channel on YouTube, has actually been the most prolific video creator, with 233 videos generating 243 million views since the start of the Playoffs — the most of any single creator. The NBA’s Facebook page was second at 154M views, followed by House of Highlights (Youtube) at 80.8M, NBATV (Facebook) at 70M and ESPN (YouTube) at 56.4M. YouTube videos generated the most views in the timeframe, with 1.1 billion.
Ranking the Conference Finalists in terms of views, the Warriors’ Facebook page was tops (and seventh overall) with 47.9M, followed by the Bucks’ Facebook page (26.4M), Raptors’ Facebook (18.6M) and Blazers’ Facebook (17.8M).
[embed]https://www.youtube.com/watch?v=EzzRlILp4kw[/embed]
While those creators had the most total views, some of the top individual videos came from accounts that typically aren’t focused on basketball at all. Google’s “Here to Help: NBA Schedules” was the No. 1 video during the Playoffs with 14 million views, while Red Table Talk’s “First Ladies of the NBA: Meet the Currys” was sixth with 6.3M. However, Ximo Pierto seemed to own much of that leaderboard, too, with eight of the top 20 NBA videos since the Playoffs began.
We were also curious about hotspots of conference finals tune-in, so we worked with Inscape, the TV measurement company with glass-level data from a panel of more than 11 million smart TVs and devices, to get viewership maps of U.S. DMAs. As you may expect, the majority of people were tuning in from the West Coast (San Francisco and Portland DMAs in particular), and around Milwaukee, Green Bay and Madison (on the maps below, the darker the color, the more households were tuning in).
Those markets make sense, given the Western Conference Finals was between the Warriors (based in Oakland) and Portland Trail Blazers. In the East, the Raptors vanquished the Bucks in six games.
Western Conference Finals
The Warriors swept the Blazers in four games airing on May 14, 16, 18 and 20, and the viewership hotspots largely stayed consistent across those dates. The map below is from Game 1 on May 14, but there was little deviation from this distribution.

Eastern Conference Finals
Hotspots for the Eastern Conference Finals weren’t quite as consistent during the six-game series that aired games on May 15, 17, 19, 21, 23 and 25. The first three games were pretty similar to the map for the Warriors-Blazers series, with the markets of the three U.S.-based conference finalists the most tuned-in. Game 1’s map below carries over pretty similarly for Games 2 and 3.

However, once the Western Conference Finals wrapped up, the Milwaukee-Toronto series largely lost that audience — at least to the extent they were previously tuning in. All of Games 4, 5 and 6 were pretty concentrated on Wisconsin, where the Bucks were attempting to make their first NBA Finals appearance since 1974.

