What ‘Slow Start?’ Streaming for Netflix’s Most Popular Original Shows Was Actually Up 5% Through the First Six Weeks of 2023
Turns out, Nielsen's claim that viewing of SVOD original series is down 8% can be poked full of holes, even by the audience measurement company's own data

The smarter way to stay on top of the streaming and OTT industry. Sign up below.
You are now subscribed
Your newsletter sign-up was successful
On Monday, Bloomberg ran a story headlined, ”After a rough 2022, streaming services are off to a slow start.“
The news service punctuated its thesis in its story lead, quoting Nielsen data showing that, ”Ratings for the most-popular streaming originals dropped about 8% from a year ago.”
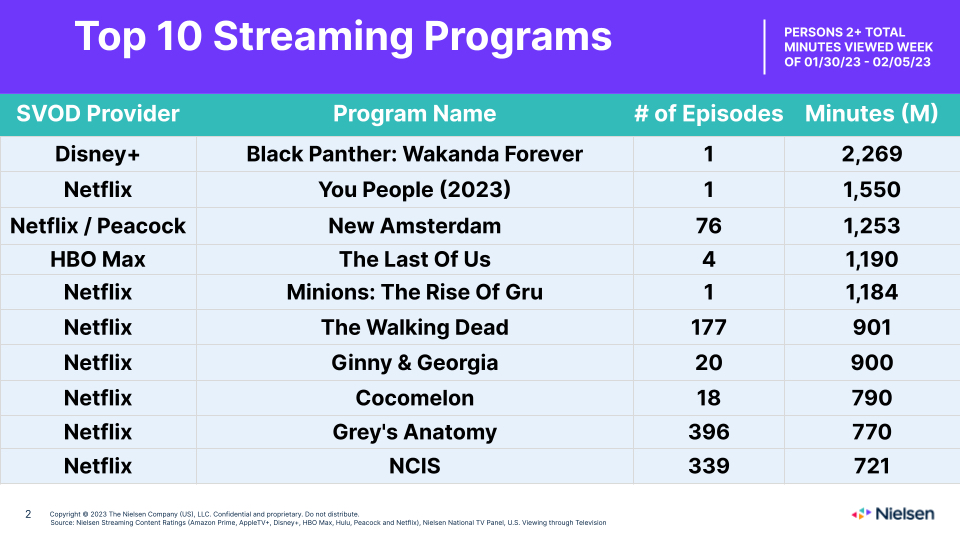
Further supporting its thesis that viewership of original shows just for streaming is down so far this year, Bloomberg noted that seven of the top 10 streaming programs for Nielsen’s most recent measurement week, January 30-February 5, are either off-network series or theatrical movies hitting the SVOD window (see list below).
Comparing Nielsen’s Jan. 30-Feb. 5 overall streaming rankings to its comparable numbers a year ago, we found that Nielsen’s 2022 ranker did indeed only include three shows that weren’t streaming originals — Disney Plus’s animated film Encanto, as well as off-network shows Cocomelon and NCIS.
But as Next TV revealed early last summer, Nielsen’s streaming metrics — which only measure U.S. audience usage on “glass” (connected TV), and not viewing on mobile phones and tablets — can be deceiving.
Also read: Who's No. 1 in Subscription Streaming? Muddled Metrics Methodologies Make Matters Murky
On Tuesday, Next TV tabulated and compared the viewing hours for the top five English-language films and TV shows each week on Netflix through the first six weeks of 2022 and 2023 and found that total streaming time was actually up 5% year over year.
The smarter way to stay on top of the streaming and OTT industry. Sign up below.
And it was Netflix originals that drove this surge.
Among English-language TV series, only one non-original show, NBC off-net procedural drama New Amsterdam, factored into our Netflix tabulation/comparison. And New Amsterdam's influence was minimal — the show only appeared in the rankings for one week once, finishing at No. 5 for the week of January 30-February 5.
Three non-original movies made the weekly top 5 in Netflix’s English-language movie rankings through the first six weeks of 2023 — Sing, Minions: The Rise of Gru and Puss in Boots. But Netflix's movies aren't nearly the audience driver that its original TV shows are. And only one of the titles, the Minions sequel, generated an audience of at least 20 million viewing hours in a given week.
So the bulk of viewership for Netflix’s English-language programming is generated by its most popular original shows, and Netflix’s data reveals that this viewership is up year over year, not down.
Netflix measures streaming usage on all devices across most of its 190-country footprint. And while it doesn't offer true ”third party“ measurement, comparing its numbers year-to-year does at least render an apples-to-apples snapshot.
And across both Nielsen and Netflix’s respective rankers, we are largely talking about the same shows, because Netflix's domestic viewership base dwarfs every major SVOD competitor.
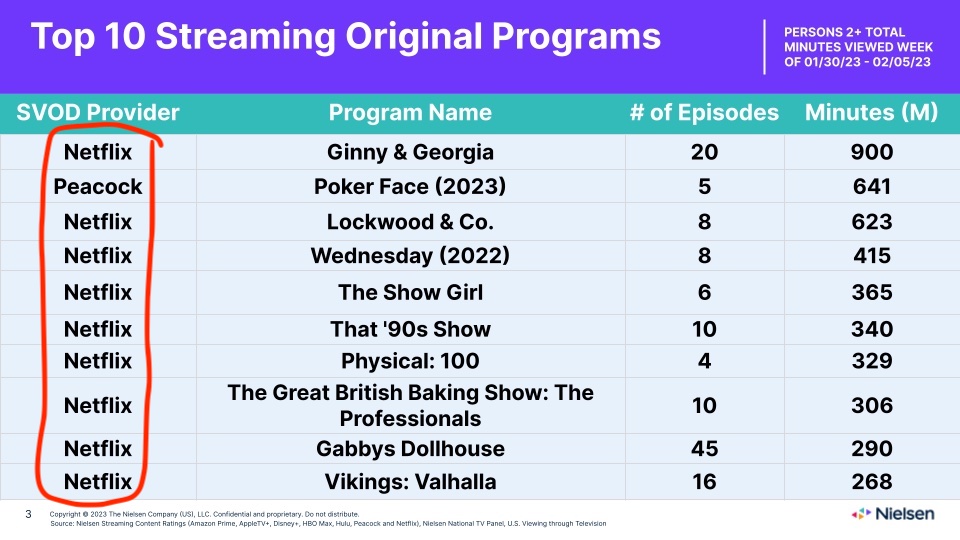
Not only are seven of the 10 shows in Nielsen’s latest overall streaming rankings on Netflix, a full nine of 10 of the entries on the research company's sub-ranking of “streaming originals” come from the No. 1 SVOD platform.
Netflix is still competing on a different audience scale vs. its competitors, and Nielsen’s core program rankings strategy remains flawed because of that.
Bloomberg probably isn't wrong about the U.S. growth of streaming subscribers slowing overall, as the domestic market matures and big operators like Disney and Warner Bros. Discovery cut back on programming to stem direct-to-consumer losses.
And hard data already tells us that significantly fewer shows are already being ordered by the major subscription streaming services. But we don’t think this emerging supply-side dynamic has affected viewer demand, at least not yet.
Are there really fewer “streaming original” hits these days? Bloomberg said Netflix has only had “one smash” so far this year with the second-season debut of Ginny and Georgia in January. But extending the measurement period out a few weeks from January through all of February finds the “hit factor” to be fairly even year over year.
Through the first two months of 2022, Netflix saw only two series generate weekly audience consumption of at least 100 million streaming hours — Cobra Kai: Season 4 and Inventing Anna.
This year, Netflix has had three series reach that 100-million-hour, seven-day benchmark through February: Ginny & Georgia: S2 (twice), Kaleidoscope and Outer Banks: Season 3.
Further kicking the tires on Bloomberg’s claim about fewer streaming hits this year:
The news service noted — quite correctly, it anecdotally seems — that HBO’s The Last of Us and Peacock’s Poker Face are the “two buzziest” TV shows of the year, across either linear or streaming.
But The Last of Us, Bloomberg said, “doesn’t count“ as a “streaming original” because it can also be found on linear HBO. And notably, Nielsen doesn't include the zombie apocalypse-themed videogame adaptation in its “originals” streaming sub-rankings, either.
In an era in which parent company WBD is aggressively pulling back from the previous management regime’s “streaming-first” strategy, exactly what HBO series would now qualify as a streaming original under Bloomberg and Nielsen’s stringent guidelines? You can't just remove HBO from the streaming discussion just because a sizable portion of its distribution is linear.
In fact, as we roll along and media companies look to sustain their linear channels as long as they can while committing to a slower, less loss-intensive build of digital, the definition of streaming original might become increasingly blurred.
For example, are NBC shows like Night Court, which delivers considerable streaming audiences on Peacock starting the day after its episodes debut on national broadcast, just linear series?
Finally, directing the scrutiny back to Nielsen, the research company just last week published its latest monthly overall TV viewership market share summary, The Gauge, which showed streaming usage was up nearly 10 points from January 2022 to January 2023.
Our question: How could U.S. streaming capture 10 percentage points more in share of total viewing time if usage of its most popular original shows is down 8%? ■
Daniel Frankel is the managing editor of Next TV, an internet publishing vertical focused on the business of video streaming. A Los Angeles-based writer and editor who has covered the media and technology industries for more than two decades, Daniel has worked on staff for publications including E! Online, Electronic Media, Mediaweek, Variety, paidContent and GigaOm. You can start living a healthier life with greater wealth and prosperity by following Daniel on Twitter today!


