Nielsen: Streaming's Share of Overall TV Viewing Up 10% in Just One Year
Connected TV viewing of YouTube is also way up

The smarter way to stay on top of the streaming and OTT industry. Sign up below.
You are now subscribed
Your newsletter sign-up was successful
Despite dubious transparency and questionable methodologies, Nielsen remains a preeminent presence in measuring domestic TV audiences.
And it's monthly "Gauge" market share tracker, introduced in 2021, has continued to draw attention.
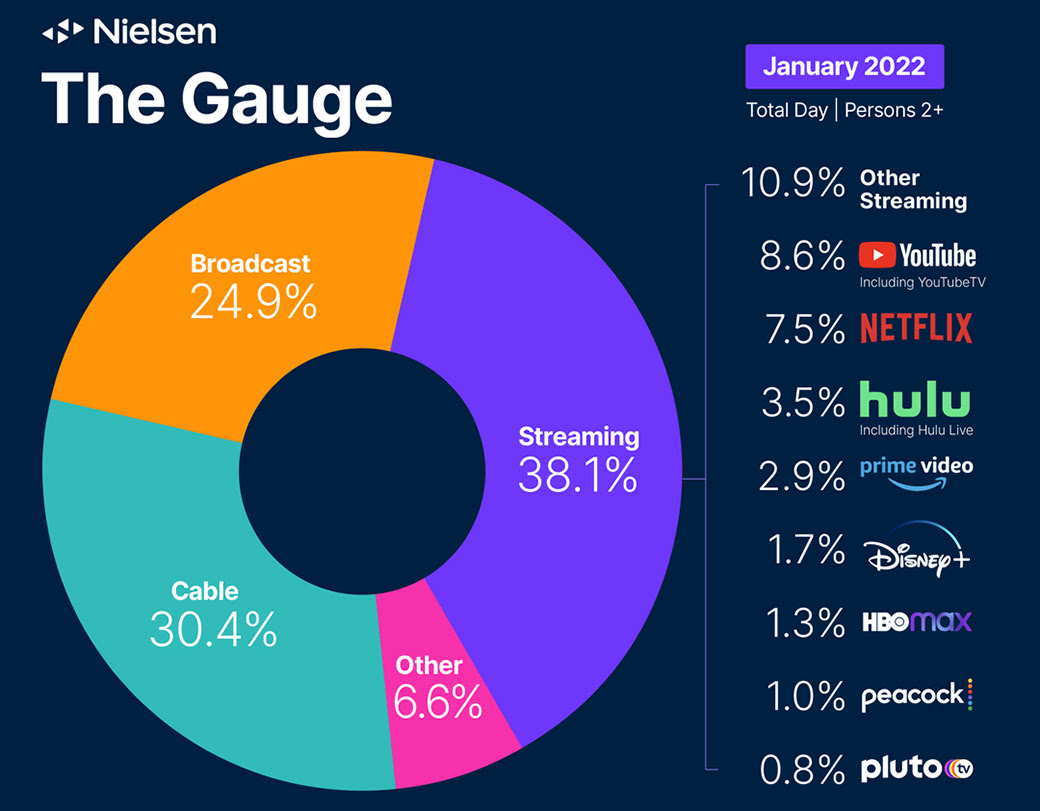
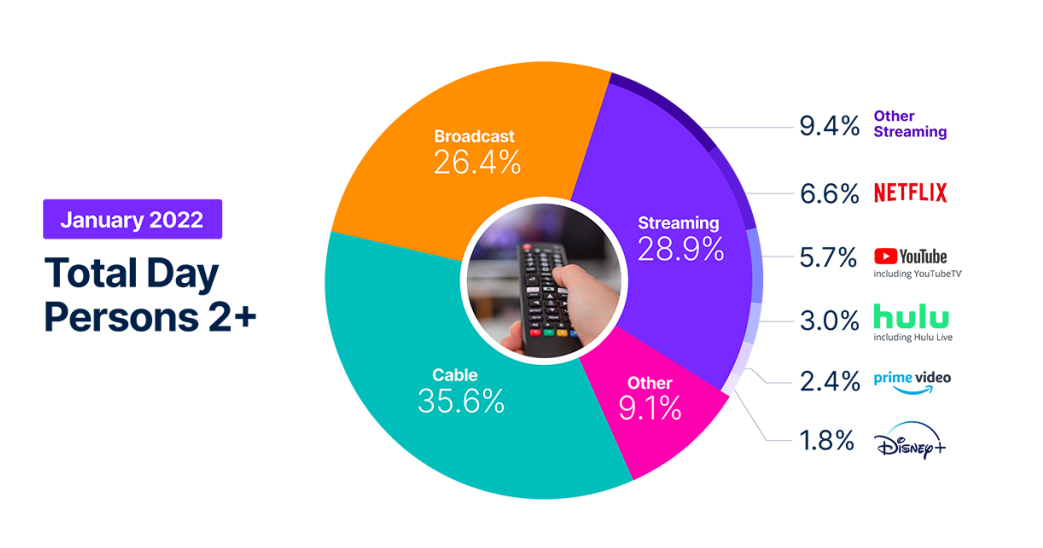
On Wednesday, Nielsen released its latest graphic, highlighting U.S. TV usage for January. "Streaming" occupied 38.1% of the overall viewing pie. That's up nearly 10% from the 28.9% it registered in Nielsen's comparable "Gauge" from January 2022.
We compare Nielsen's market share charts from year to year below. We pulled the graphics from two different sources, so they're formatted differently. Don't judge.
Among other notable differences: YouTube connected-TV viewing, including virtual pay-TV service YouTube TV, is up over three points. We can't explain that.
Also, viewing of basic cable programming networks seems to be collapsing much faster than linear broadcast.
The smarter way to stay on top of the streaming and OTT industry. Sign up below.
Daniel Frankel is the managing editor of Next TV, an internet publishing vertical focused on the business of video streaming. A Los Angeles-based writer and editor who has covered the media and technology industries for more than two decades, Daniel has worked on staff for publications including E! Online, Electronic Media, Mediaweek, Variety, paidContent and GigaOm. You can start living a healthier life with greater wealth and prosperity by following Daniel on Twitter today!


