TV By the Numbers: Watch-Time, Ad Impressions Jump for NHL Hockey
With insights from Vizio’s Inscape and iSpot.tv

The smarter way to stay on top of broadcasting and cable industry. Sign up below
You are now subscribed
Your newsletter sign-up was successful
This is a quick snapshot of TV by the numbers for the week of May 10-16, revealing the most-watched shows and networks using glass-level data from Vizio’s Inscape, and the top shows and networks by TV ad impressions with insights via iSpot.tv.
Most-Watched Shows and Networks
Via Inscape, Vizio’s TV data product with glass-level insights from a panel of more than 17 million active and opted-in smart TVs. Data is linear, live TV only and includes all episode types (new and reruns). Rankings are by percent share duration (i.e., time spent watching).
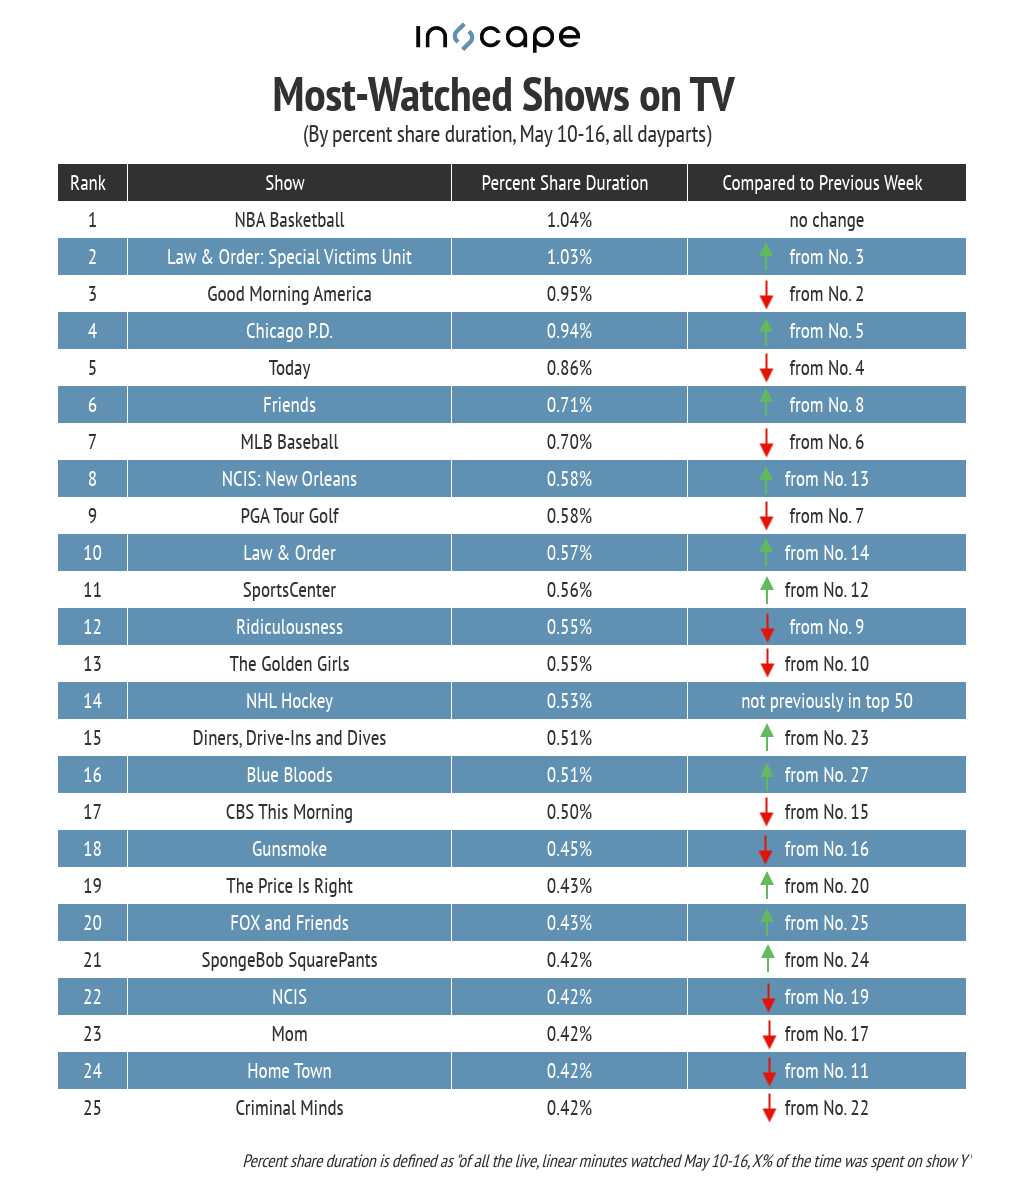
NBA basketball held on to first place for watch-time, receiving 1.04% of all minutes watched during the week. Elsewhere in the sports world, MLB baseball and PGA Tour golf both saw week-over-week decreases, while NHL hockey, which wasn’t previously in the top 50 by watch-time, jumped into the ranking at No. 14. Thanks in part to syndicated reruns on USA Network and ION, Chicago P.D. rose up the ranking to fourth place, surpassing Today.

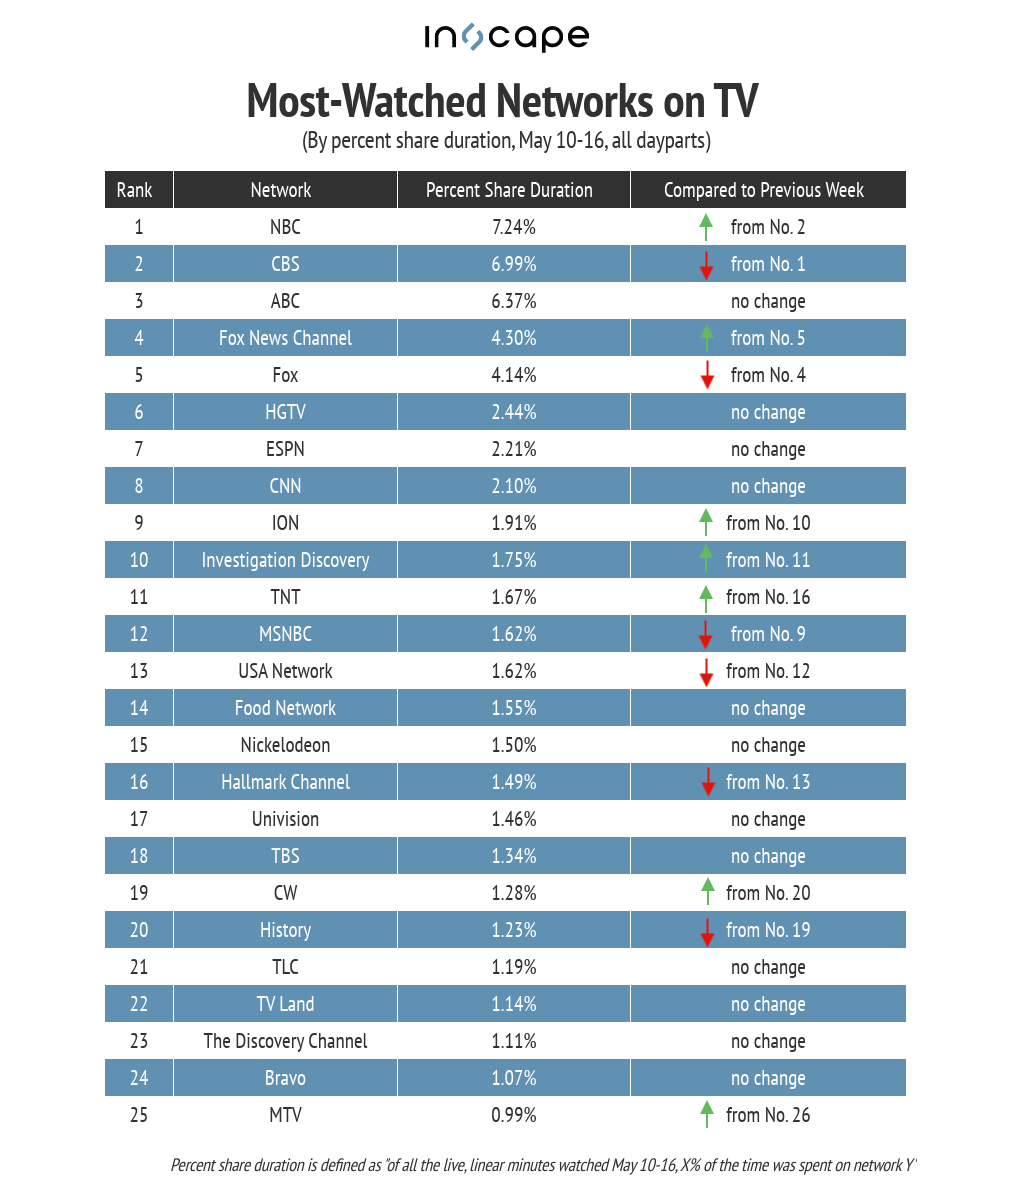
NBC took first place on the network ranking (7.24% of watch-time), fueled in part by NHL hockey and The Voice. ABC remained steady in third, while Fox News surpassed Fox with 4.30% and 4.14% of minutes watched, respectively. TNT had the biggest week-over-week ranking increase, up to No. 11 from No. 16, thanks in part to NBA basketball games. And although it had less than 1% of network watch-time (0.99%), MTV landed in the ranking at No. 25.

Top Shows and Networks by TV Ad Impressions
Via iSpot.tv, the always-on TV ad measurement and attribution company. Rankings are by TV ad impressions, for new episodes only.
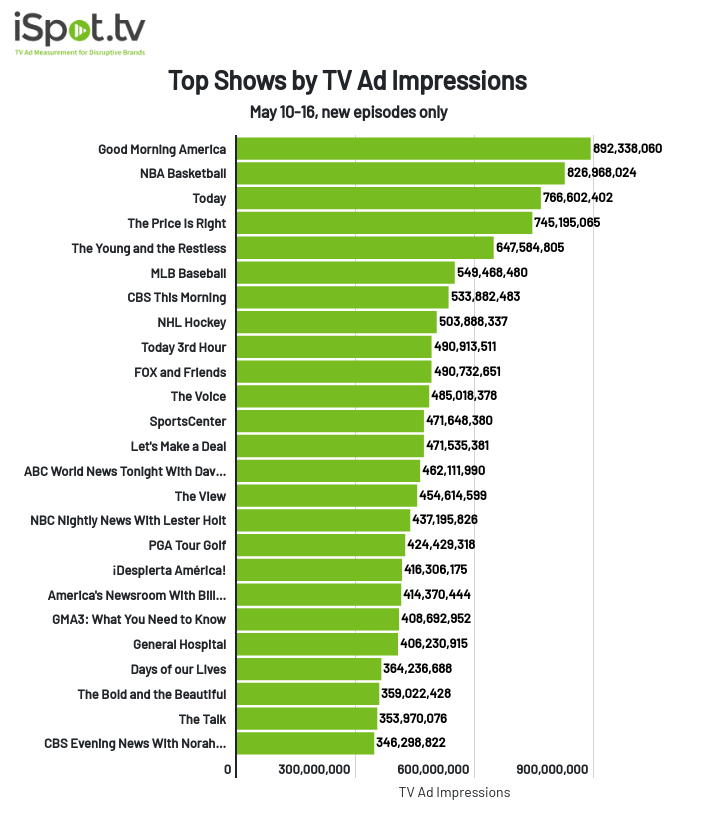
For the second week in a row, Good Morning America was No. 1 for TV ad impressions, with its 892.3 million constituting a modest 5.67% week-over-week decrease in impressions. NBA basketball was also down. Its 827 million impressions represented an 8.55% decrease from the previous week. MLB baseball’s 549.5 million impressions was a slight uptick from the previous week, while PGA Tour Golf had a 23.8% week-over-week decrease in impressions and NHL hockey rocketed into eighth place with 503.9 million TV ad impressions. The Voice — which aired two episodes — jumped up to No. 11 from No. 24 the previous week, with 485 million impressions.

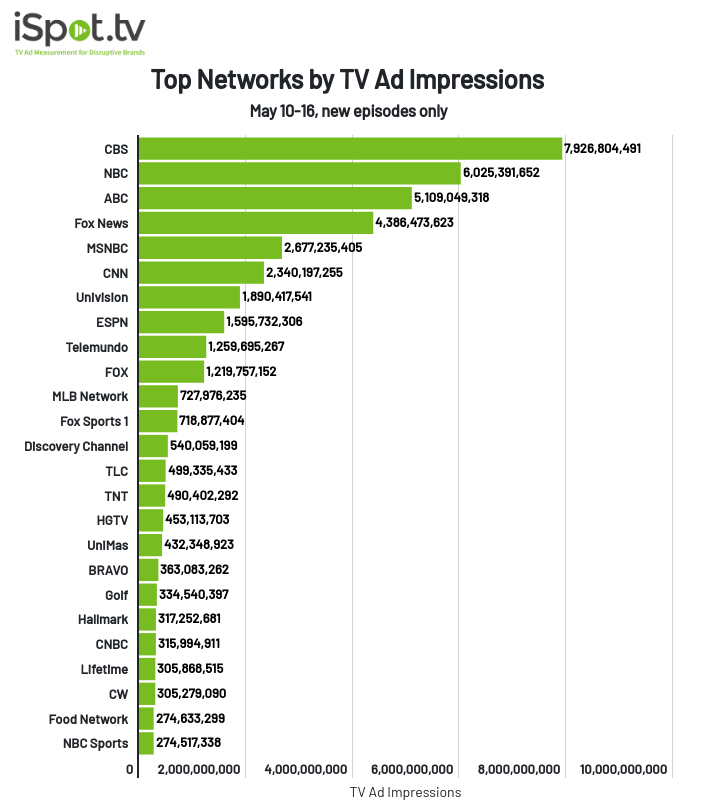
CBS stayed in first place on the network ranking, edging up from 7.5 billion impressions last week to 7.9 billion. Thanks in part to The Voice and NHL hockey, NBC had an 18.17% week-over-week increase, with its 6 billion impressions landing it in second place. Fox News also saw a bump, with its 4.4 billion impressions representing a 15.40% increase from the previous week. After a week absent from the top 25, Lifetime rejoined the ranking with 305.9 million impressions, fueled by new episodes of Married at First Sight and Married at First Sight Australia.
The smarter way to stay on top of broadcasting and cable industry. Sign up below

