TV By the Numbers: Aug. 10-16
Stanley Cup Playoffs lead time spent watching, while NBA generates most ad impressions

The smarter way to stay on top of broadcasting and cable industry. Sign up below
You are now subscribed
Your newsletter sign-up was successful
The following is a snapshot of television by the numbers for the week of Aug. 10-16, highlighting the most-watched shows and networks using glass-level data from Inscape, and the top shows and networks by TV ad impressions with insights via iSpot.tv.
Most-Watched Shows and Networks
Via Inscape.tv, the TV data company with insights from a panel of more than 15 million smart TVs. Data is linear, live TV only and includes all episode types (new and reruns). Rankings are by percent share duration (i.e., time spent watching).
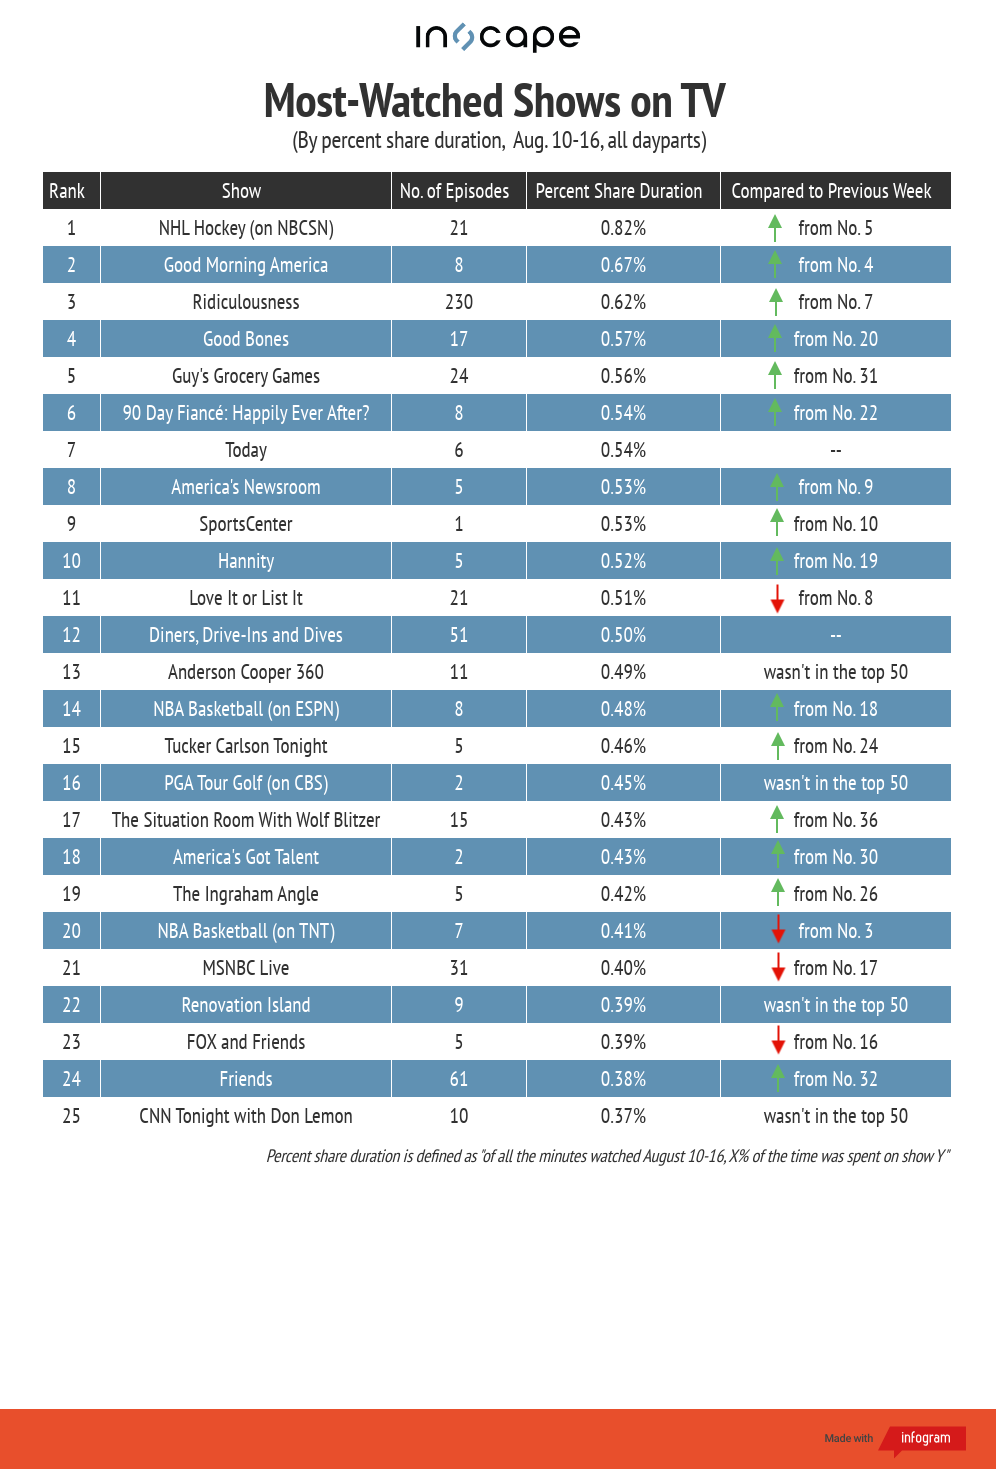
Examining shows, of all the minutes watched by smart TVs that Inscape measured in all dayparts, 0.82% of the time was spent on NBCSN’s broadcast of NHL hockey (specifically, the Stanley Cup Playoffs). ABC’s Good Morning America (0.67%) and MTV’s Ridiculousness (0.62%) finished second and third, respectively, by share duration.

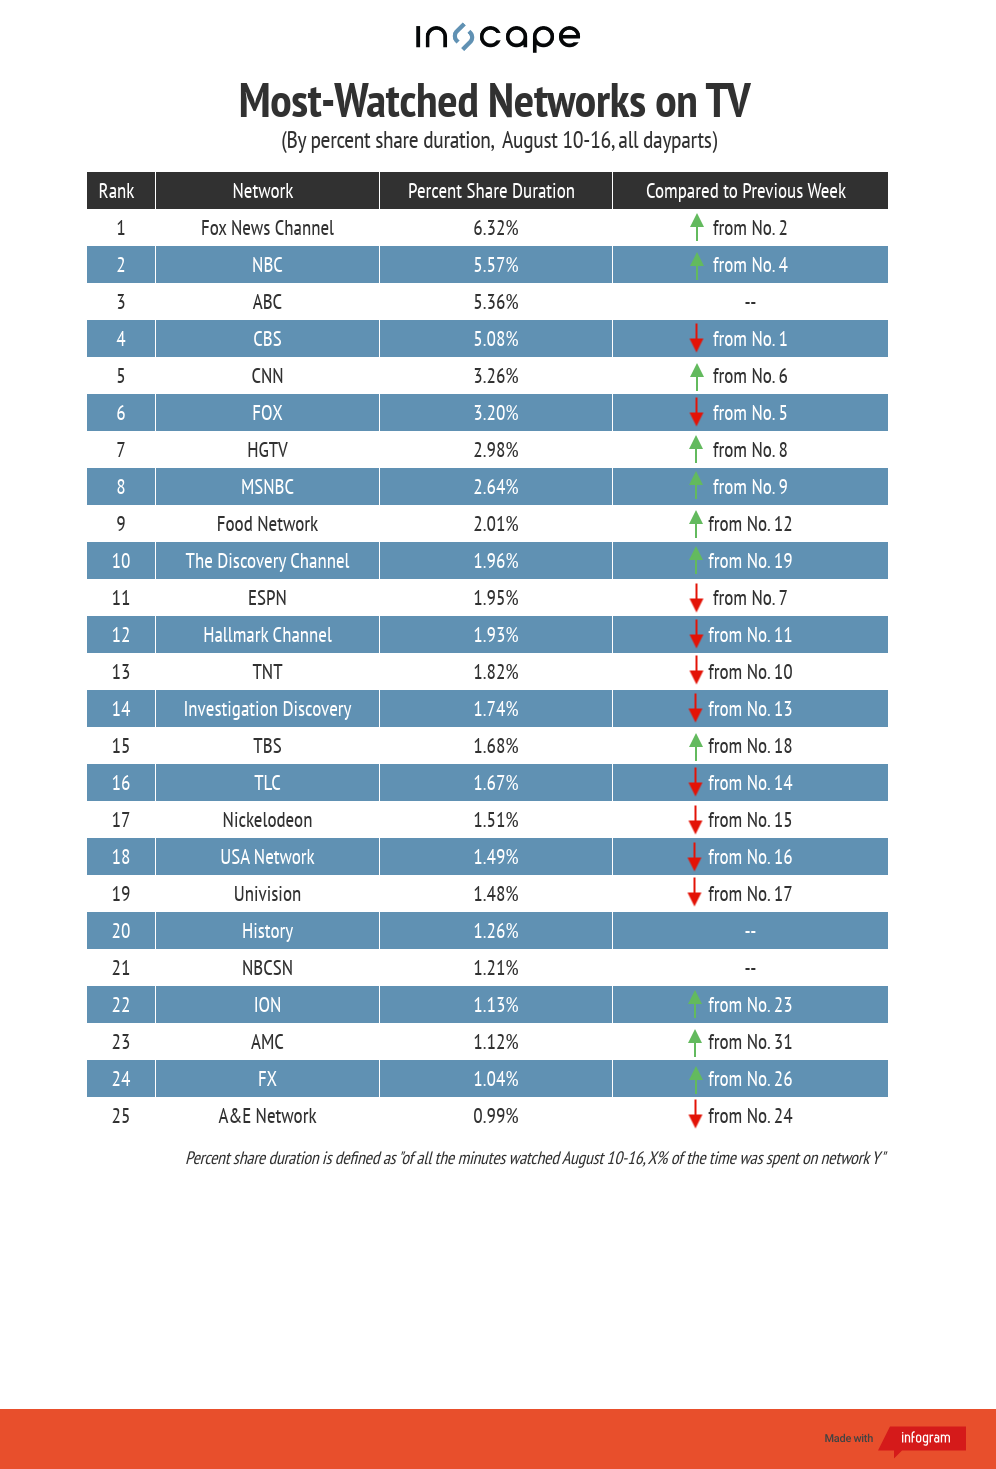
For networks, of all minutes watched last week, 6.32% of the time was spent on Fox News -- a one-spot jump from the previous week, when the network was No. 2. The second-place spot went to NBC (5.57%), then ABC (5.36%) was third, followed by CBS (5.08%) and CNN (3.26%). The week’s top mover was Discovery Channel (1.96%), which climbed from 19th to 10th partly on the strength of its annual “Shark Week” special.

Top Shows and Networks by TV Ad Impressions
Via iSpot.tv, the always-on TV ad measurement and attribution company. Rankings are by TV ad impressions, for new episodes only.
The smarter way to stay on top of broadcasting and cable industry. Sign up below
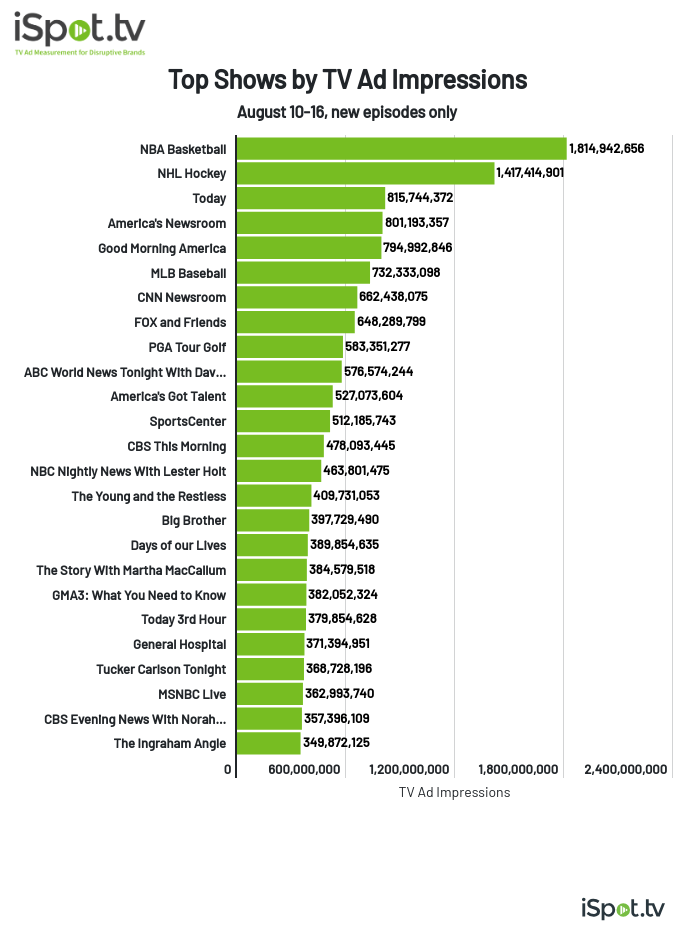
NBA basketball remained atop the rankings, with 1.8 billion TV ad impressions on the week, followed by NHL hockey (1.4 billion), Today (816 million) and America’s Newsroom (801 million). Sports-related programming once again made its presence known among the top shows. Five of the top 12 by impressions were sports-related (NBA, NHL, plus MLB baseball at No. 6, PGA Tour golf in ninth and SportsCenter in 12th). But it was news that saw the biggest footprint on the rankings, with 15 of the top 25 spots.

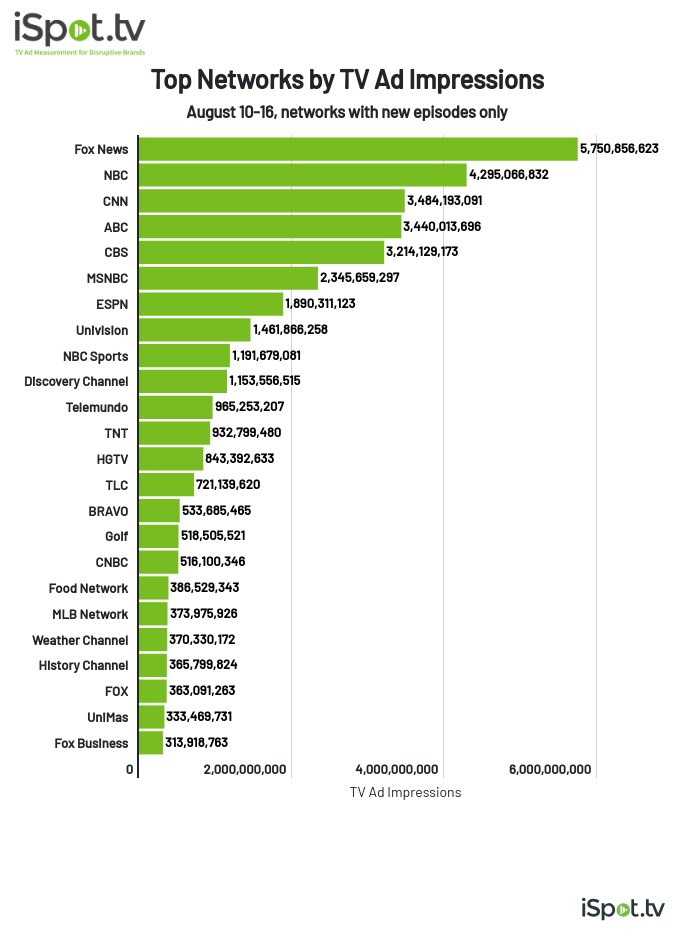
Fox News was still the highest impression-generating network, with 5.8 billion impressions, followed by NBC (4.3 billion), CNN (3.5 billion) and ABC (3.4 billion). Sports-focused networks also ranked highly, with ESPN (1.9 billion impressions), NBC Sports (1.2 billion), Golf Channel (519 million) and MLB Network (374 million) all among the top 25 networks by impressions during shows with new episodes. TNT (933 million) saw high impression totals as well airing plenty of NBA games during the week.

John Cassillo is an analyst and contributor with TV[R]EV.
