By the Numbers: Super Bowl LIII

The smarter way to stay on top of broadcasting and cable industry. Sign up below
You are now subscribed
Your newsletter sign-up was successful
Another football season has come to a close and the New England Patriots have secured yet another championship title. We took a look at the viewership and advertising trends around the Big Game using insights from Inscape and iSpot.
Note: Data below is based on estimates generated through 11 a.m. EST on Tuesday, Feb. 5.
According to real-time TV ad measurement company iSpot, overall 67 brands ran 194 ads which generated over 10 billion TV ad impressions. Those ads also generated 8.1 billion social impressions and 491.9 million online views.
Guest Blog: It Takes a Village to Get Super Bowl Spots on the Air
A Big Night for Entertainment Brands
Both movie studios and streaming services came out to play, generating not only millions of TV ad impressions but also getting buzz on social.
Movie studios (Marvel, Walt Disney Studios, CBS Films, Universal Pictures, Twentieth Century Fox and Paramount Pictures) generated 436.1 million TV ad impressions and accounted for 21.29% of the digital share of voice* (DSOV) — the most out of all industries that advertised during the game.
The smarter way to stay on top of broadcasting and cable industry. Sign up below
Marvel led the way: Avengers: Endgame generated 62.3 million TV ad impressions, 355.4 million social impressions and 12.6 million online views, and accounted for 15.61% DSOV. Captain Marvel racked up 76.3 million TV ad impressions, 178 million social impressions and 2.6 million online views, with a DSOV of 3.93%.
Streaming services (Hulu, Amazon Prime Video, YouTube TV, CBS All Access and Netflix) had 3.39% DSOV of all industries and generated nearly 566 million TV ad impressions. Of the services, Hulu had the biggest DSOV (1.74%) and over 70.8 million TV ad impressions on its big game placement promoting The Handmaid’s Tale, plus 10.8 million online views and 69.9 million social impressions.
The second place streaming finisher, Amazon Prime Video, managed to generate a bunch of digital activity with one spot, a trailer for Hanna, its upcoming series about a girl with extraordinary skills. The spot generated 86.7 million TV ad impressions, 20.2 million online views and had 95.2 million social impressions, with a DSOV of 0.88%.
Viewership Trends via Inscape
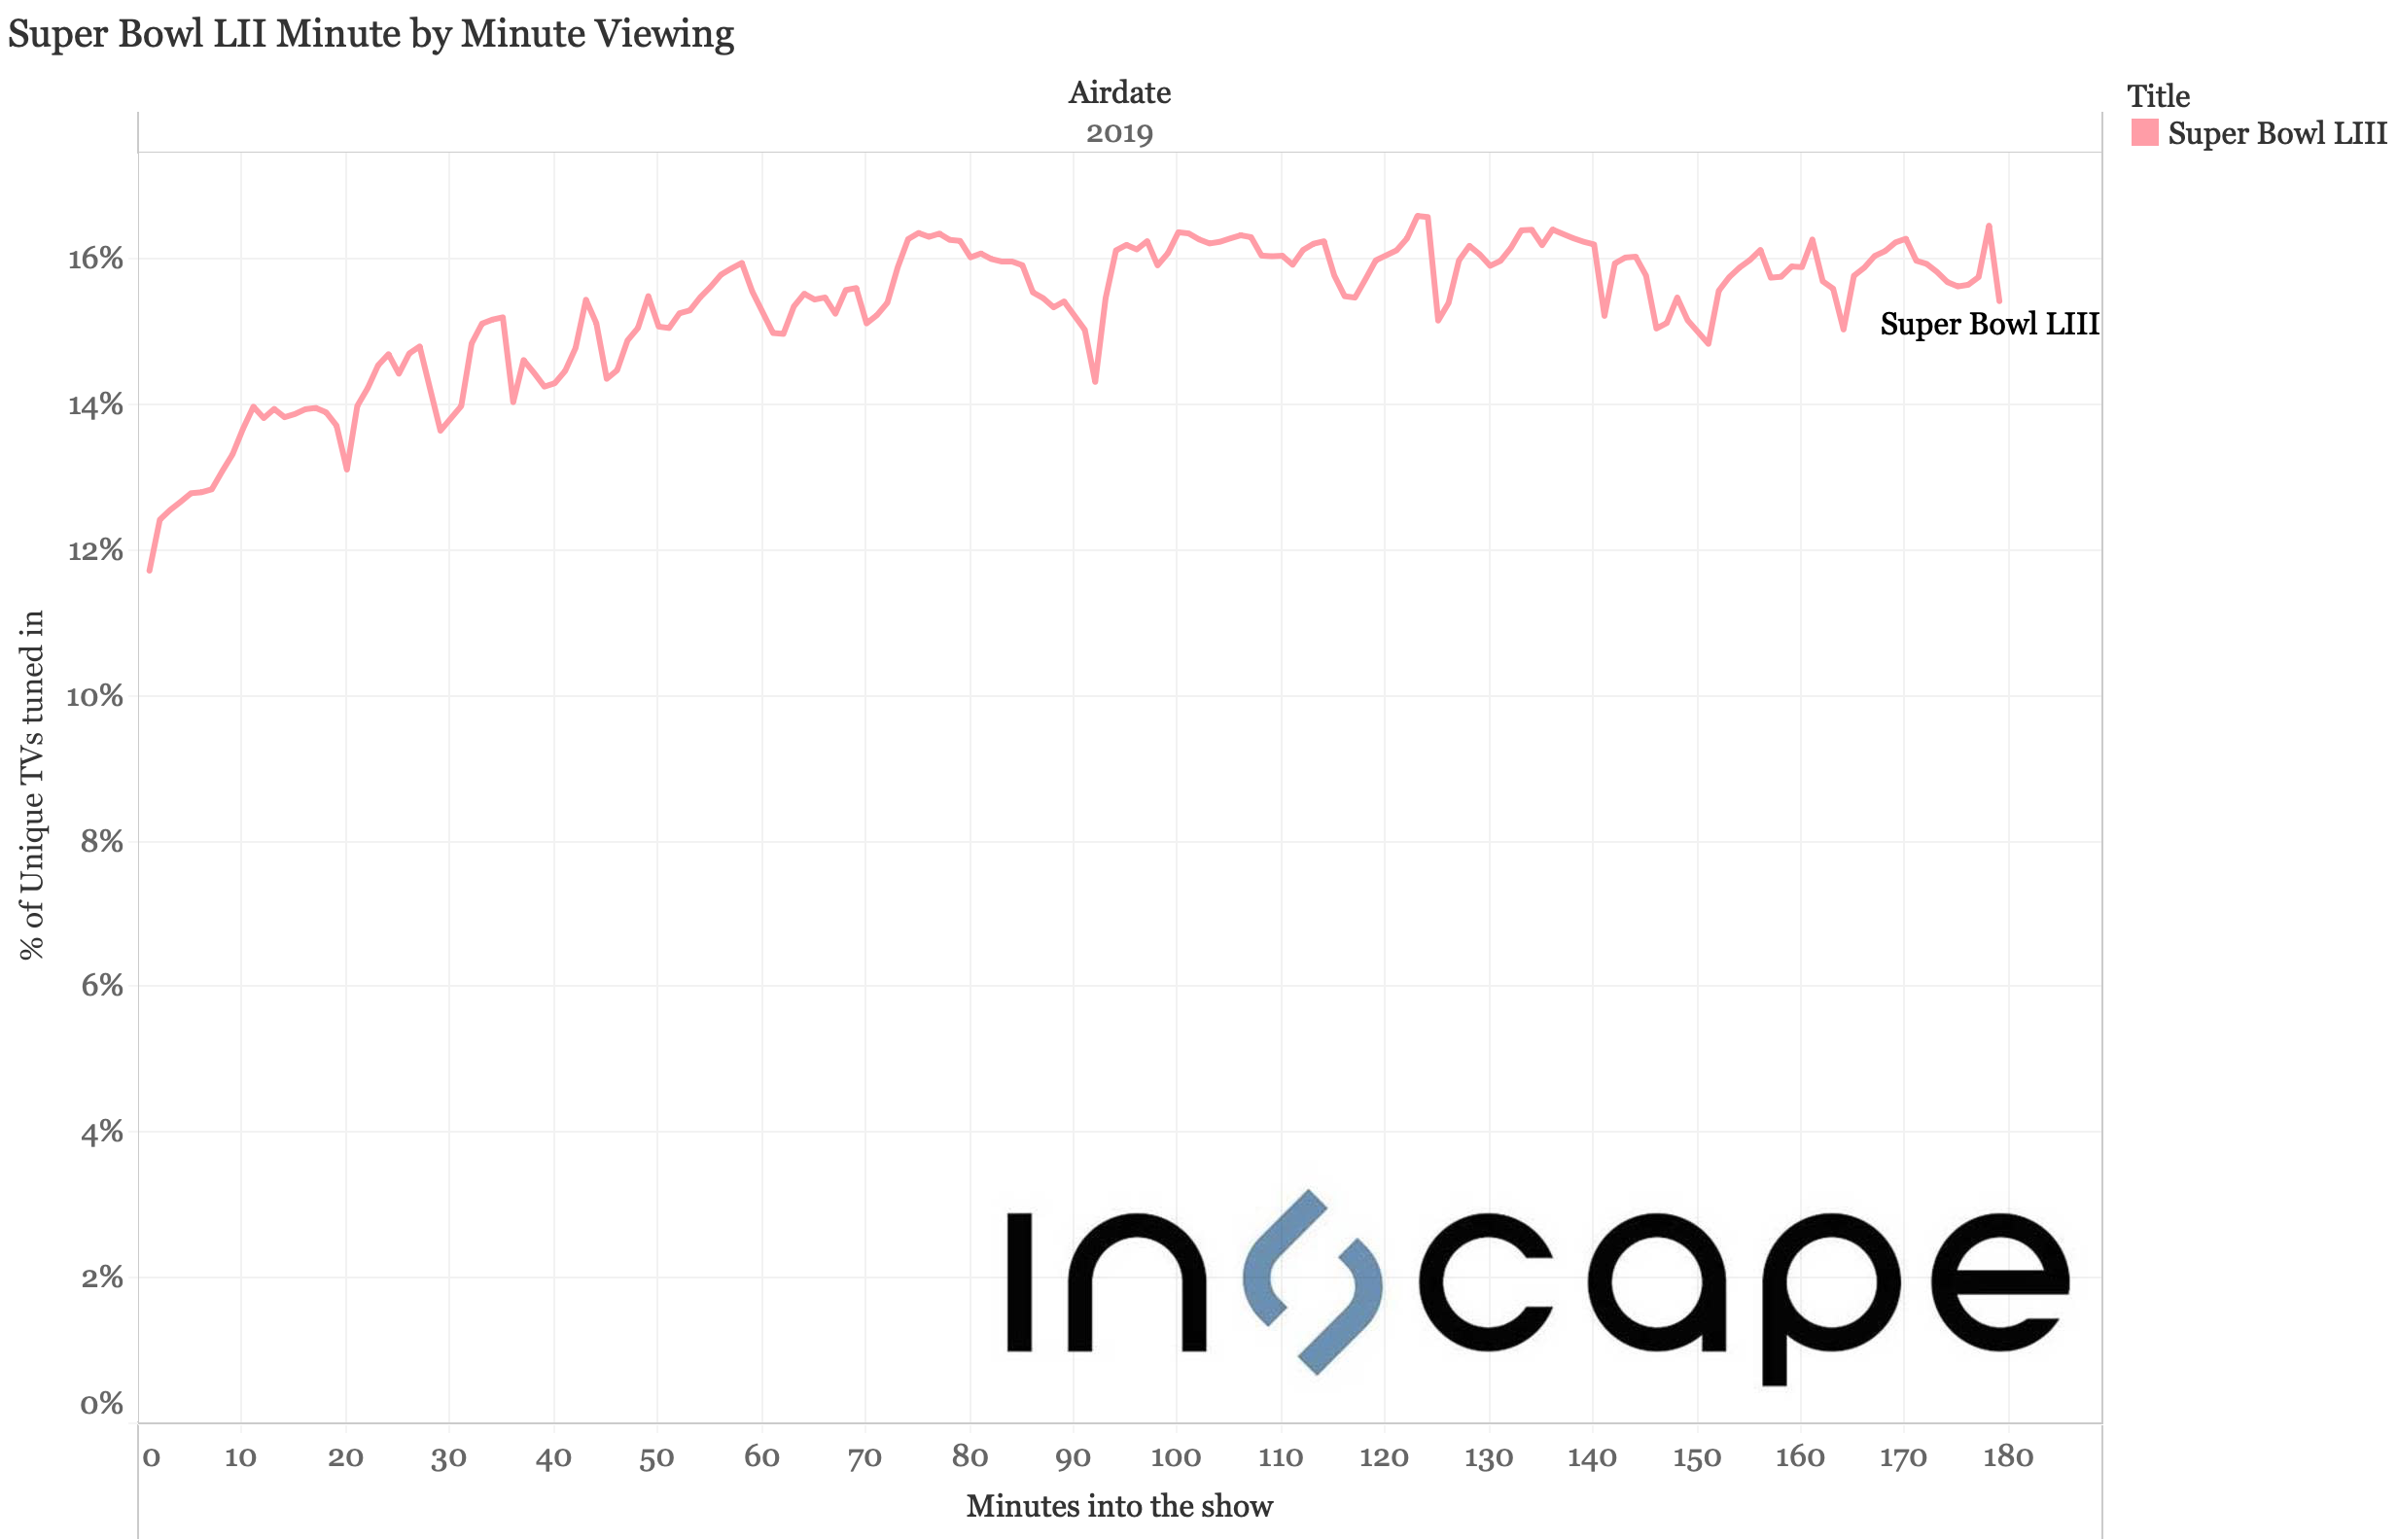
Below is a look at minute-by-minute viewership courtesy of Inscape, the TV data company with glass-level insights from a panel of more than 10 million smart TVs and devices. Although tune-in rose gradually during the first part of the game, it leveled off in the second half — which is not surprising, given the low score and mostly absent on-field action in a 13-3 game.

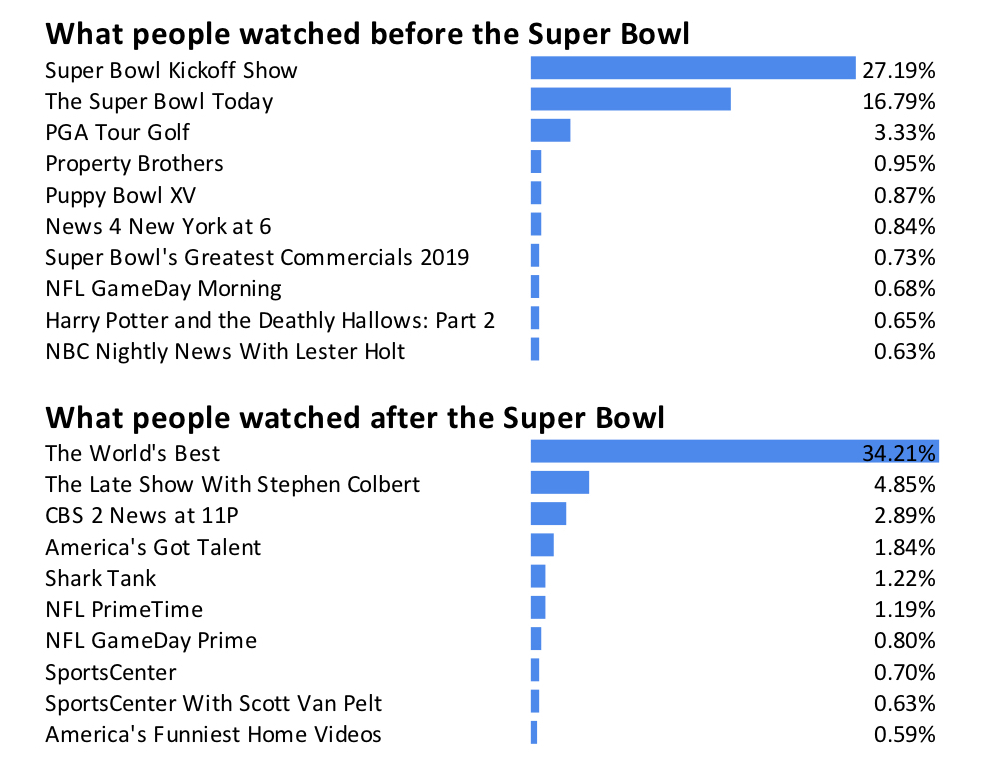
Inscape also looked at what else people were watching on Super Bowl night. Before the game, a majority of people were tuned into pre-Super Bowl shows and PGA Tour Golf; afterwards many stayed with CBS to catch The World's Best, a new series that premiered immediately following the game, with a smaller subset tuning into The Late Show With Stephen Colbert.

*Digital Share of Voice (DSOV) = a scoring of all earned views, actions and searches across YouTube, Facebook, Twitter, iSpot and search engines (Google, Bing, Yahoo), added up and weighted based on significance of action to a brand (a view or share > “like”).
