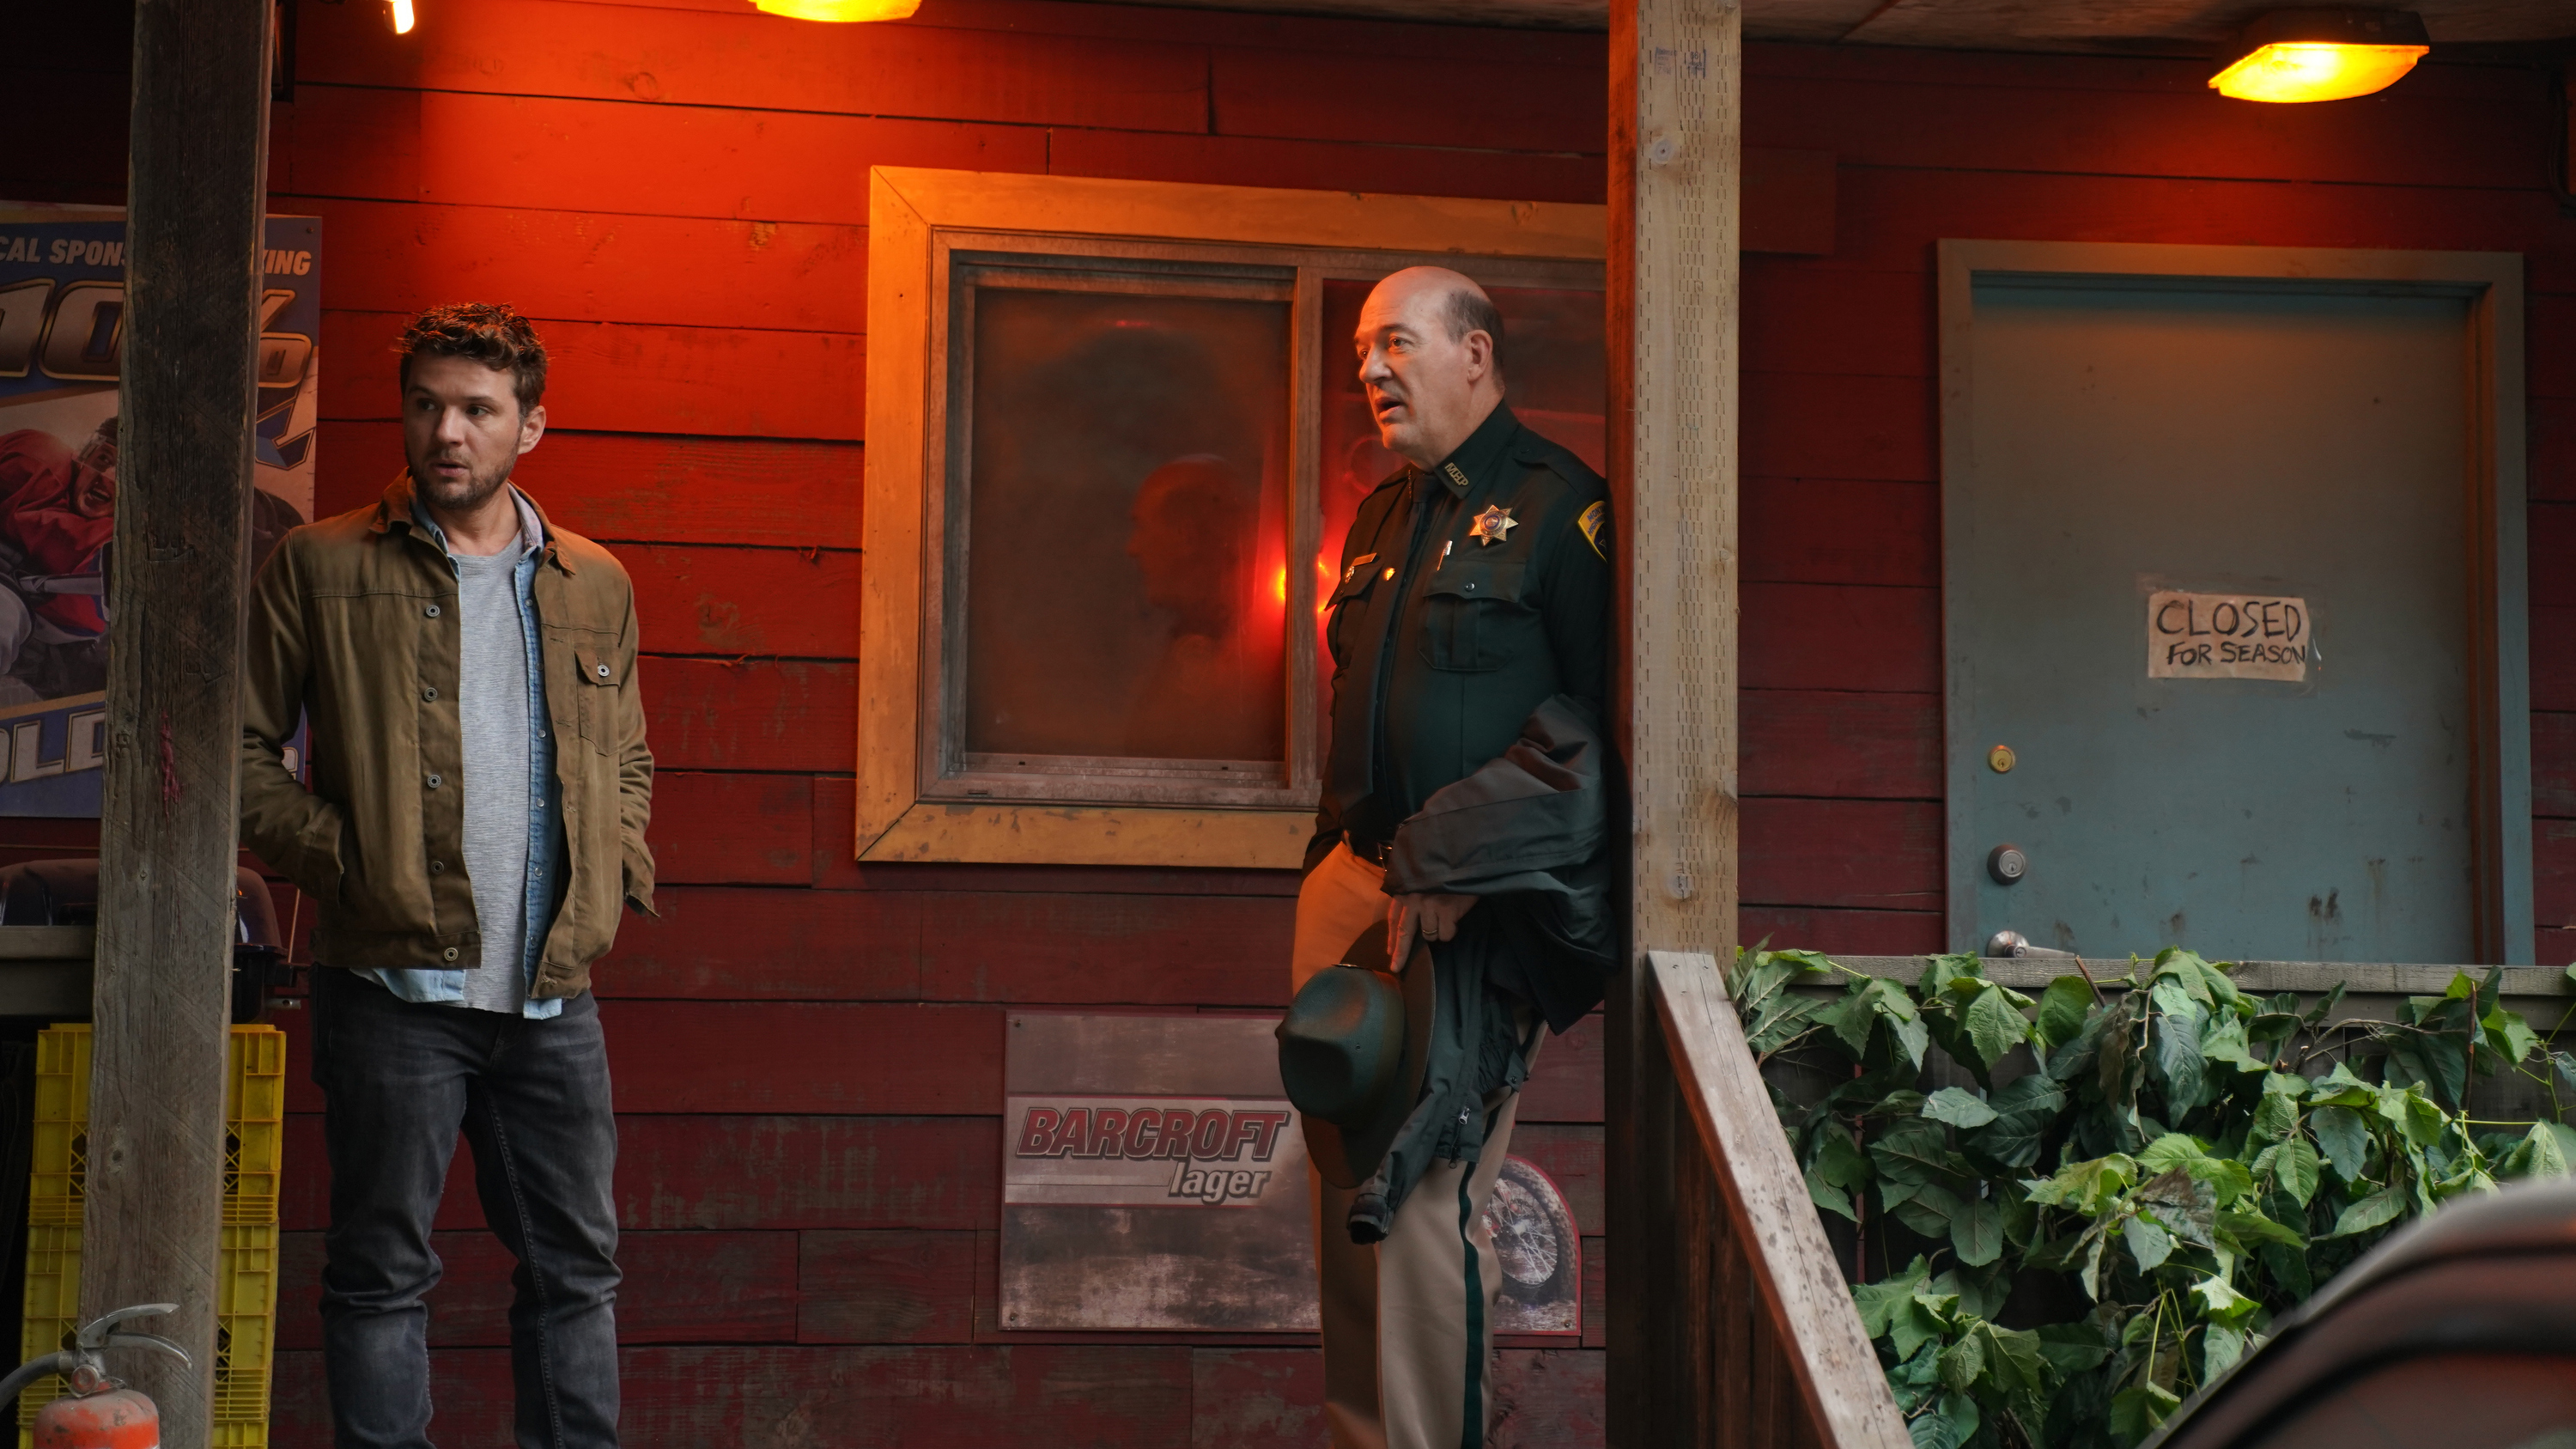
ABC Gives ‘Big Sky’ TV’s Biggest Promo Push
And more from Promo Mojo, our exclusive weekly ranking of the programming networks are promoting most heavily

The smarter way to stay on top of broadcasting and cable industry. Sign up below
You are now subscribed
Your newsletter sign-up was successful
B&C has partnered with always-on TV ad measurement and attribution company iSpot.tv to bring you a weekly chart we call Promo Mojo: exclusive data showing the top five TV promos ranked by ad impressions. Our data covers the seven-day period through Nov. 15.
On the strength of 491.6 million TV ad impressions, an ABC promo for new drama Big Sky is No. 1.
The Alphabet Network is the only traditional broadcaster to make an appearance in our top five, as CNN takes second place to promote its political podcasts, MTV hypes the new season of Jersey Shore: Family Vacation in third, Food Network serves up a promo for Kristin Chenoweth-hosted game show Candy Land in fourth, and E! gives some love to the 2020 E! People’s Choice Awards in fifth.
Notably, the Jersey Shore spot has the highest iSpot Attention Index (117) in our ranking, meaning viewers were on average highly likely to watch it all the way through (vs. interrupting it by changing the channel, pulling up the guide, fast-forwarding or turning off the TV).
1) Big Sky, ABC
Impressions: 491,646,009
Completion Rate: 98.31
Attention Index: 108 (8% fewer interruptions than avg.)
The smarter way to stay on top of broadcasting and cable industry. Sign up below
Imp. Types: National 91%, Local 8%, VOD/OTT 1%
In-network Value: $6,286,479
Out-of-network Est. Spend: $2,955,588
2) CNN political podcasts, CNN
Impressions: 365,506,685
Completion Rate: 97.36
Attention Index: 106 (6% fewer interruptions than avg.)
Imp. Types: National 98%, Local 1%, VOD/OTT 1%
In-network Value: $1,011,365
Out-of-network Est. Spend: $8,797
3) Jersey Shore: Family Vacation, MTV
Impressions: 331,084,118
Completion Rate: 97.13
Attention Index: 117 (17% fewer interruptions than avg.)
Imp. Types: National 87%, Local 12%, VOD/OTT 1%
In-network Value: $2,502,370
Out-of-network Est. Spend: $466,040
4) Candy Land, Food Network
Impressions: 277,424,085
Completion Rate: 98.23
Attention Index: 103 (3% fewer interruptions than avg.)
Imp. Types: National 90%, Local 9%, VOD/OTT 1%
In-network Value: $867,357
Out-of-network Est. Spend: $1,001,198
5) 2020 E! People's Choice Awards, E! Entertainment Network
Impressions: 261,979,728
Completion Rate: 98.28
Attention Index: 109 (9% fewer interruptions than avg.)
Imp. Types: National 93%, Local 5%, VOD/OTT 2%
In-network Value: $2,234,181
Out-of-network Est. Spend: $1,459,663
*Data provided by iSpot.tv, TV Ad Measurement for Disruptive Brands*
Impressions - The total impressions within all US households including National Linear (Live & Time-shifted), VOD+OTT, and Local.
Attention Score - Measures the propensity of consumers to interrupt an ad play on TV. The higher the score, the more complete views. Actions that interrupt an ad play include changing the channel, pulling up the guide, fast-forwarding or turning off the TV.
Attention Index - Represents the Attention of a specific creative or program placement vs. the average in its respective industry. The average is represented by a score of 100, and the total index range is from 0 through 200. For example, an attention index of 125 means that there are 25% fewer interrupted ad plays compared to the average.
Imp. Types - Impression types tracked include National (Live + Time-shifted), Local, VOD & OTT. See below for further details.
In-network Value - Estimated media value of in-network promos.
Out-of-network Spend - The estimated amount spent on TV airing time for this promo's spots during a given date range.
National: Live - A national promo which was viewed during live linear television broadcast or same day, via DVR or on-demand.
Local - A promo that was aired during a local ad break slot.
VOD - This includes promos that run in on-demand content past three days (i.e. do not contain the linear promo load)
OTT - On-demand streaming content (i.e. Hulu, Roku, Fire TV Stick, Chromecast).
