TV By the Numbers: NFL, World Series Dominate Week of Oct. 26
Sports led, but news is moving up as America prepares for the election

The smarter way to stay on top of broadcasting and cable industry. Sign up below
You are now subscribed
Your newsletter sign-up was successful
This is a quick snapshot of TV by the numbers for the week of Oct. 26 through Nov. 1, revealing the most-watched shows and networks using glass-level data from Vizio’s Inscape, and the top shows and networks by TV ad impressions with insights via iSpot.tv.
Most-Watched Shows and Networks
Via Vizio’s Inscape, the TV data company with insights from a panel of more than 16 million active and opted-in smart TVs. Data is linear, live TV only and includes all episode types (new and reruns). Rankings are by percent share duration (i.e., time spent watching).
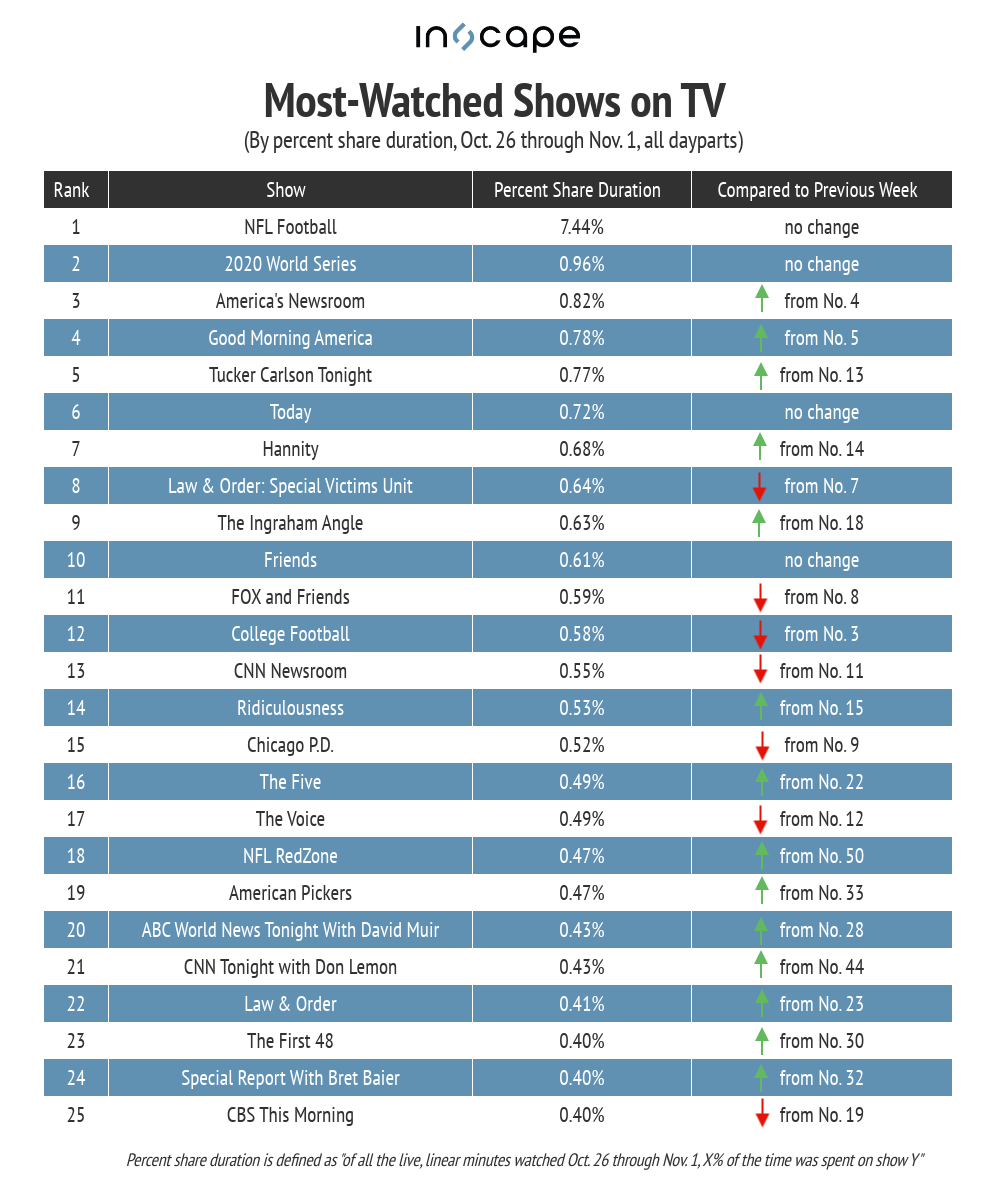
Simply put, America is spending a ton of time watching NFL games compared to everything else on TV. Of all the minutes watched last week, 7.44% were spent on NFL games, an increase from the previous week’s 6.70%. The 2020 World Series remained in second place (0.96%), while multiple news programs rose up the rankings — not surprising, as it was the last full week before the election.

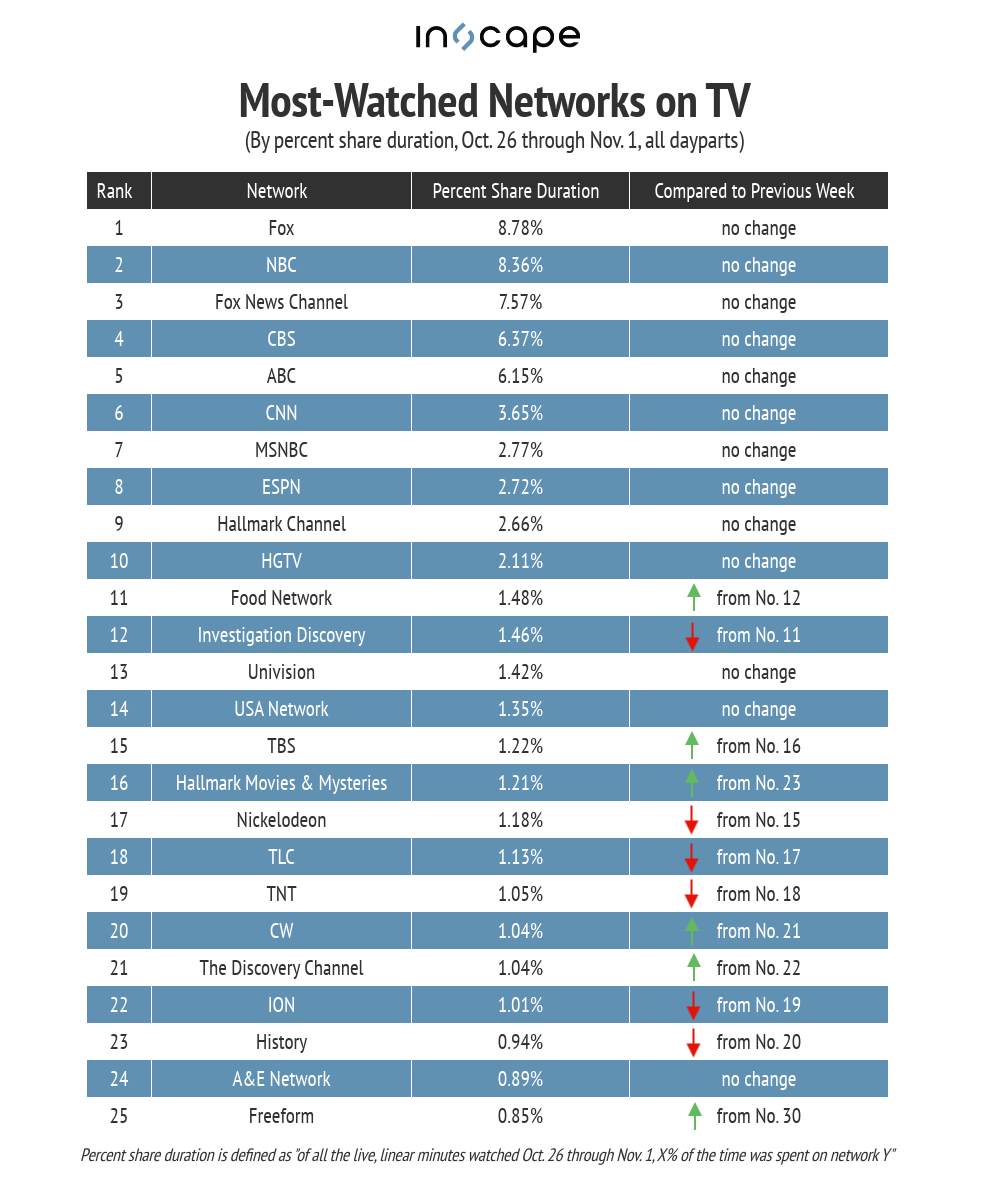
Remarkably, there were no changes in the top 10 spots of the network ranking. Thanks in part to NFL games and the World Series, Fox led with 8.78% of the minutes watched, followed by NBC (8.36%) and Fox News (7.57%). Hallmark Movies & Mysteries moved up from No. 23 to No. 16, propelled by Christmas movies that are now airing in earnest. The only newcomer to the ranking was Freeform, which edged up from No. 30 to No. 25 with 0.85% of the minutes watched.

Top Shows and Networks by TV Ad Impressions
Via iSpot.tv, the always-on TV ad measurement and attribution company. Rankings are by TV ad impressions, for new episodes only.
The smarter way to stay on top of broadcasting and cable industry. Sign up below
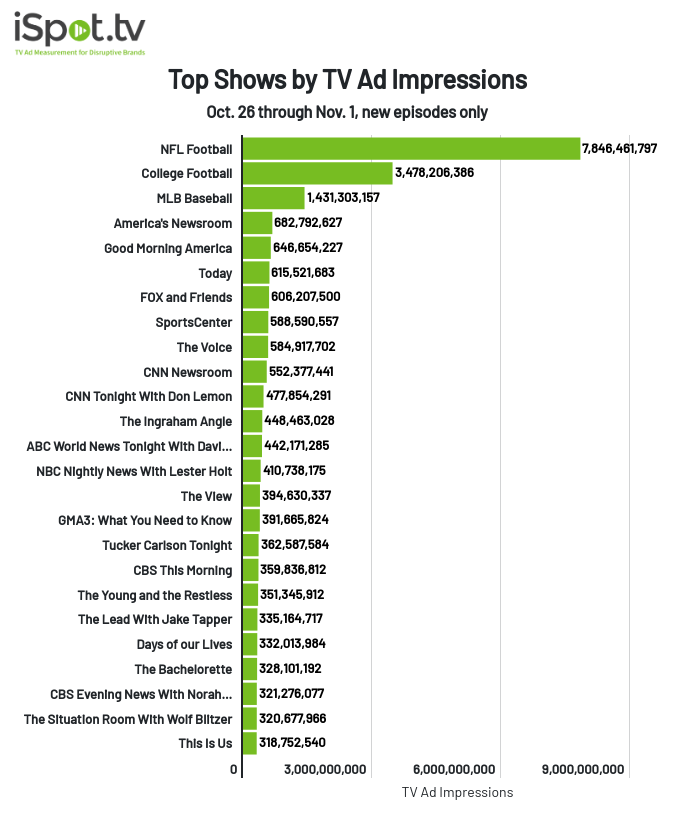
NFL led with 7.8 billion TV ad impressions, a 6.6% decrease from the previous week. College football, on the other hand, saw an 8.9% increase in impressions week-over-week, up to 3.5 billion. MLB rounded out the top three with 1.4 billion impressions. While the majority of the ranking was made up of the various news programs we see each week, a few other popular shows made the list: The Voice took ninth place with 584.9 million impressions (a 25.41% decrease from the previous week), The Bachelorette delivered 328.1 million (nearly identical to the previous week) and This Is Us returned for its fifth season, racking up 318.8 million impressions with its two episodes that aired back-to-back.

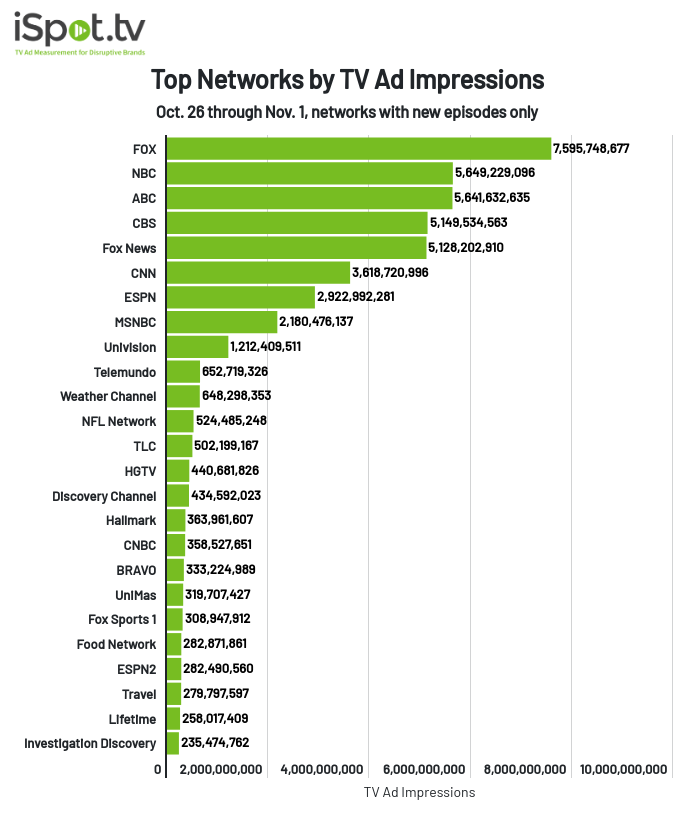
Once again, first place went to Fox with 7.6 billion TV ad impressions, but it represented a 7.42% decrease from the previous week. NBC jumped into second place with 5.65 billion impressions and ABC took third (5.64 billion). The Weather Channel rose up the ranking, thanks to Hurricane Zeta and Winter Storm Billy coverage. New entrants to the ranking included Lifetime, with its 258 million impressions driven by primarily Christmas movies, Travel (279.8 million) and Investigation Discovery (235.5 million).

