TV By the Numbers: Football Tops Week of Dec. 7
But syndicated marathons boosted watch-time for multiple series, per Vizio’s Inscape
The smarter way to stay on top of broadcasting and cable industry. Sign up below
You are now subscribed
Your newsletter sign-up was successful
This is a quick snapshot of TV by the numbers for the week of Dec. 7-13, revealing the most-watched shows and networks using glass-level data from Vizio’s Inscape, and the top shows and networks by TV ad impressions with insights via iSpot.tv.
Most-Watched Shows and Networks
Via Vizio’s Inscape, the TV data company with insights from a panel of more than 16 million active and opted-in smart TVs. Data is linear, live TV only and includes all episode types (new and reruns). Rankings are by percent share duration (i.e., time spent watching).
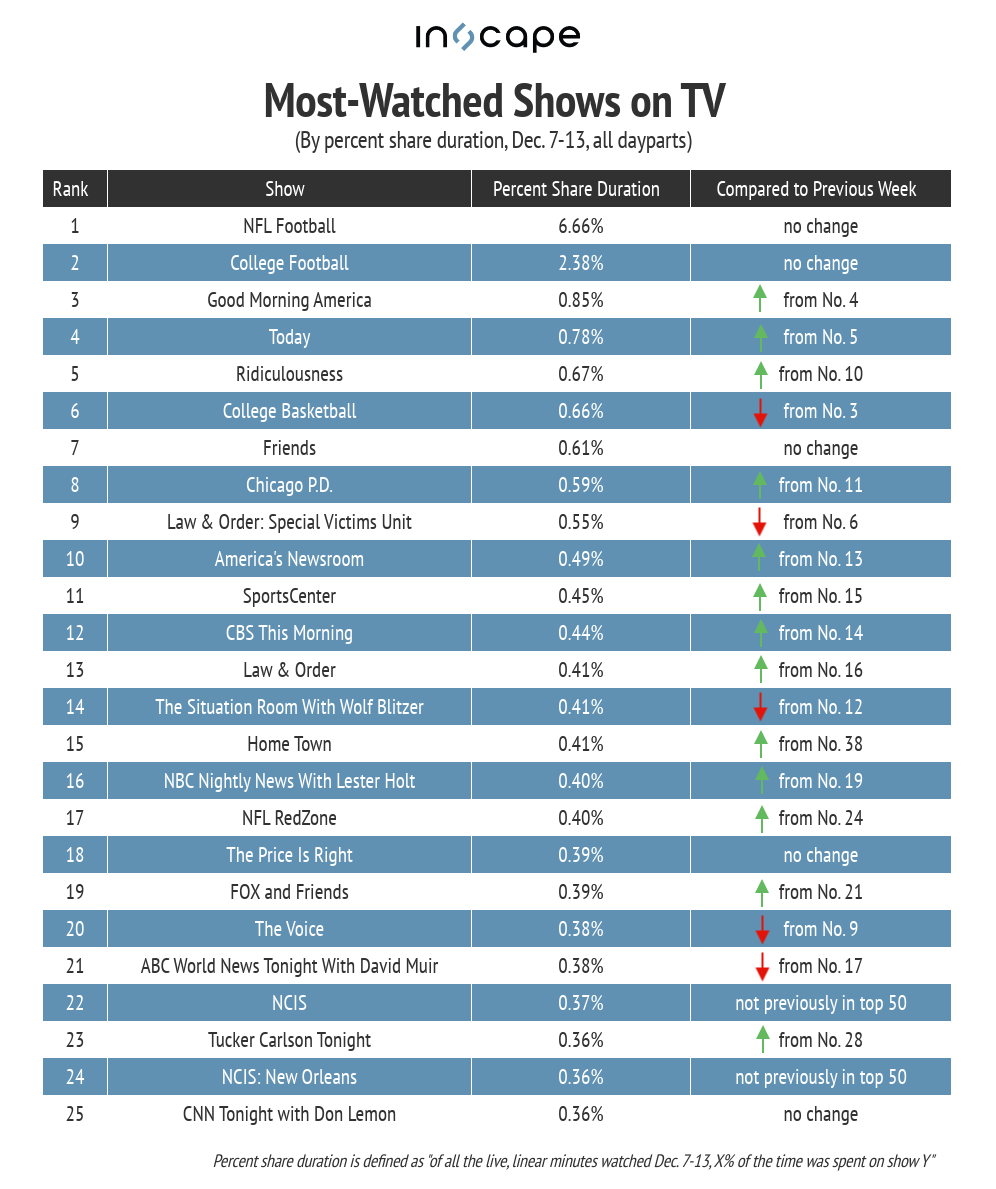
Last week, NFL games captured 6.66% of all minutes watched, a slight increase over the previous week when games only had 5.78% share duration. College football maintained its second-place position, while morning shows GMA and Today rose up, punting college basketball down the ranking to sixth. Thanks to some big marathons, shows including HGTV’s Home Town, NCIS and NCIS: New Orleans jumped into the top 25.
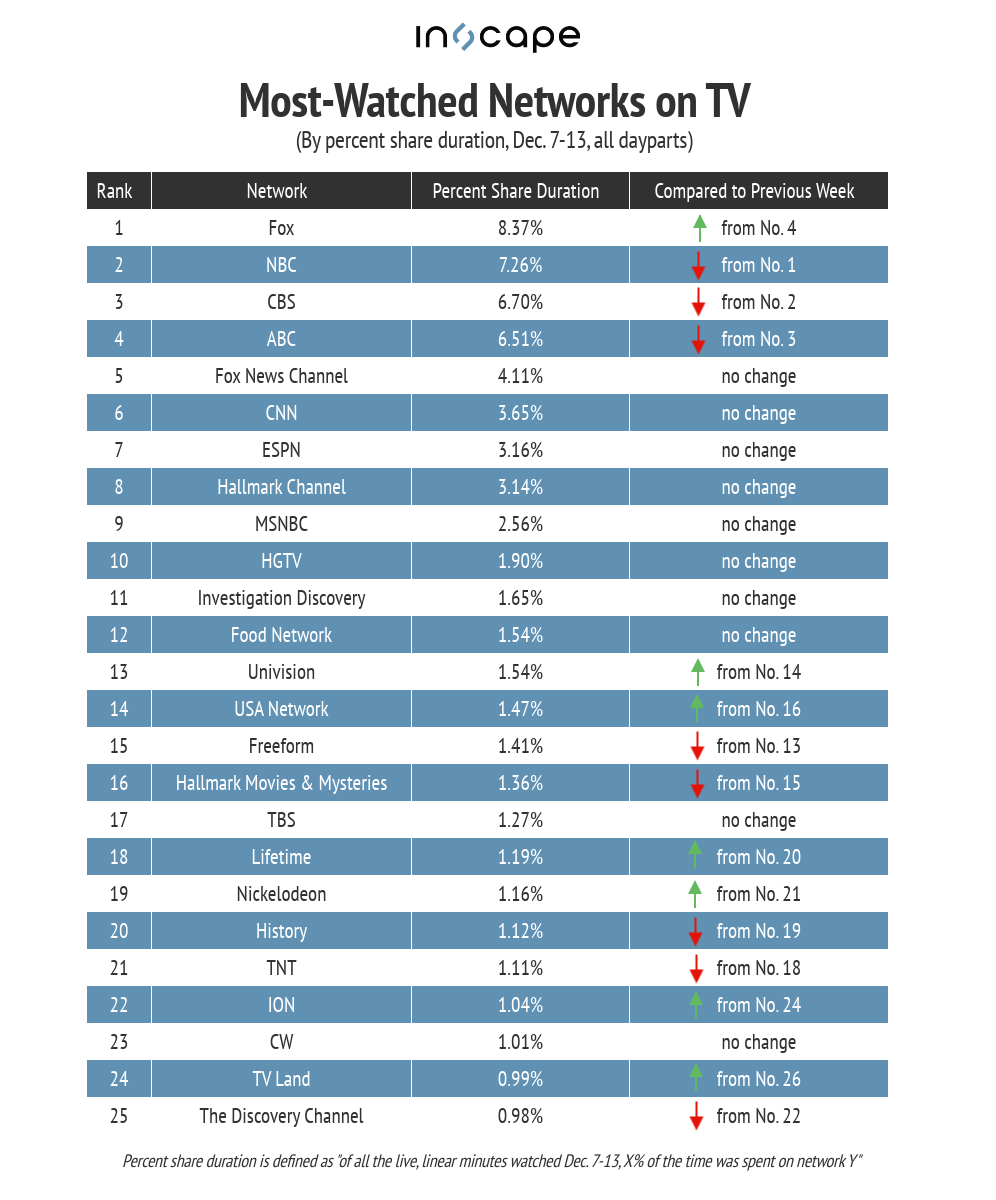
Fueled by NFL games, Fox jumped from fourth to first place with 8.37% of all minutes watched, followed by NBC (7.26%), CBS (6.70%) and ABC (6.51%). The middle of the ranking was remarkably steady week-over-week, although Univision and USA Network both rose up a few notches. The only ranking newcomer was TV Land, coming in at No. 24 (up from No. 26 the previous week) with 0.99% of all minutes watched.
Top Shows and Networks by TV Ad Impressions
Via iSpot.tv, the always-on TV ad measurement and attribution company. Rankings are by TV ad impressions, for new episodes only.
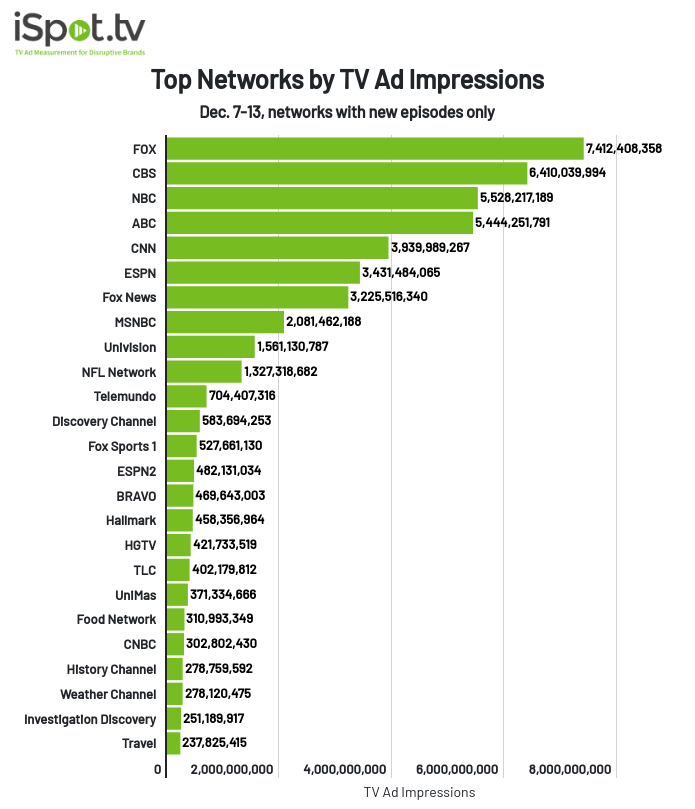
One glance at the chart below and you can see how NFL games completely dwarf everything else on TV when it comes to ad impressions, racking up 10.3 billion for Dec. 7-13. College football was the only other program to surpass a billion impressions (2.7 billion), while morning shows took third and fourth places. While The Voice was again in the top 10, it had a 30.92% week-over-week decrease in impressions, down to 497 million.
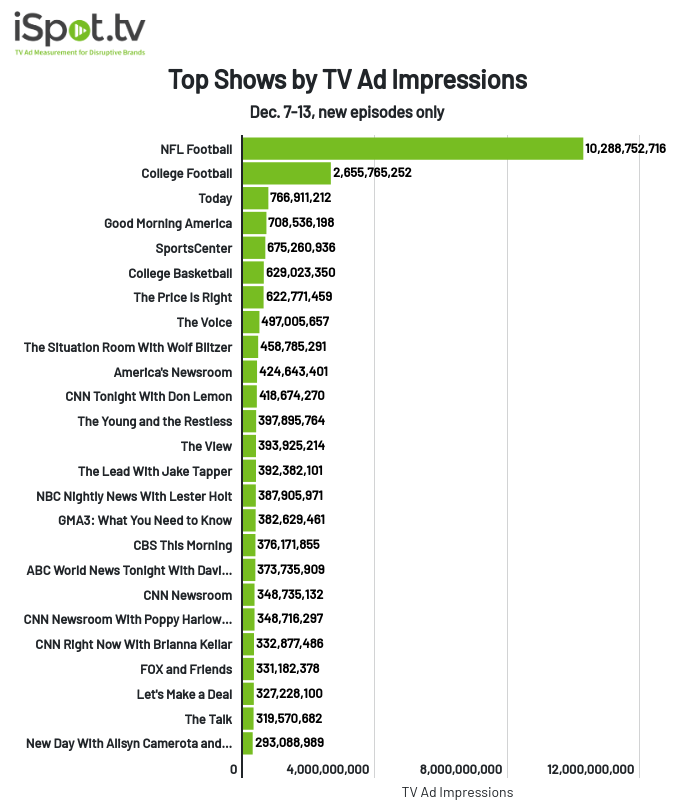
Thanks in part to NFL and college football, Fox jumped into first place with 7.4 billion impressions — a 209% week-over-week increase — while the other big broadcasters all experienced impressions decreases compared to the previous week. NFL Network also had a notable increase in impressions (252%), up to 1.3 billion. And while there was some shuffling going on in terms of the order week-over-week, there were no new networks in the top 25.
The smarter way to stay on top of broadcasting and cable industry. Sign up below
