SMI: Upfront Accounted for 76% of National TV Spending

The smarter way to stay on top of broadcasting and cable industry. Sign up below
You are now subscribed
Your newsletter sign-up was successful
With the broadcast networks’ upfront presentations a week away, research company Standard Media Index has produced a report that shines some light onto the mystery of what happens in those late-night negotiations.
Based on data for this broadcast season through March, SMI says that 76% of national TV spending took place in the upfront; 18% of dollars were bought in the scatter market and the remaining 6% was direct response.
Upfront spending is up 3.7% so far. The extra spending in the upfront has affected scatter, which is down 11.5% from the previous year.
According to SMI, NBC had the biggest shareof upfront spending, at 17.3%, up from 15.6% a year ago. CBS had a 13.2% share, down from 16.1% a year ago when it had the Super Bowl. ABC had a 12.1% share, down from 12.7%. Fox, boosted by the Super Bowl, had a 9.3% share, up from 8.2%.
Rounding out the top 10 networks in the upfront are ESPN, up 3.4%; TBS, down 1.4%; TNT, up 1.7%; Univision, down 12.7%; AMC, down 28.9% and The CW, up 18.2%.
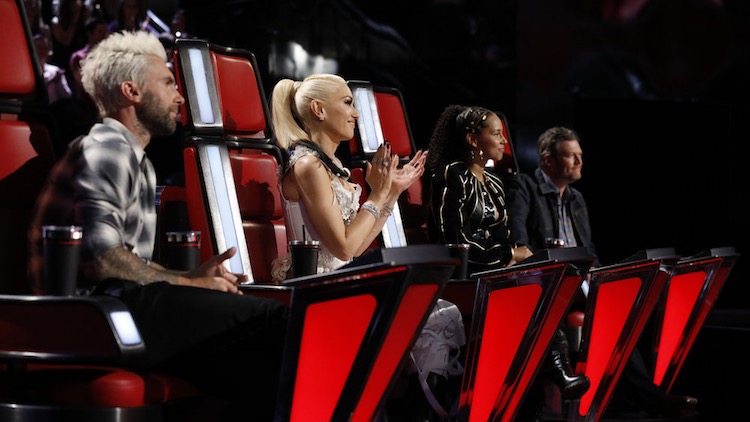
The shows drawing the most upfront dollars were NFL football, the NCAA men’s basketball tournament,The Voice, and Big Bang Theory.
Those were followed by more sports programming: college football, NBA, the Super Bowl and the World Series.
The smarter way to stay on top of broadcasting and cable industry. Sign up below
Other popular primetime shows in the upfront includedThe Walking Dead, NCIS, Law & Order: SVU, Grey’s Anatomy, This Is Us, The Bachelor, EmpireandModern Family.
How hot was last year’s scatter market? Spots on Fox’sEmpiresold for $747,832 per 30 seconds in scatter, up 39% from their upfront price. Advertisers paid $391,443 for spots in CBS’ Big Bang Theory, up 34% from scatter. Because the season is still ongoing, SMI did not provide similar numbers for this year’s scatter market.
Special broadcasts draw special prices in the upfront, but reflecting soft ratings, ad spending was down too in the 2016-17 upfront. ABC got commitments for $41.2 million in spending from the Oscars during the upfront, down 7% from the prior year. There was $24.2 million put down for the Grammys, down 22.4%, and $24.1 million for the Golden Globes, up 0.7%.
Among the cable news networks, CNN and MSNBC expanded their share of upfront dollars, while Fox News had the lion’s share at 42.9% but was down from 45.6% the prior year.
SMI says that CNN’sAnderson Cooper 360got the most ad dollars during last year’s upfront, more than Fox News’ recently canceledO’Reilly Factor. O’Reilly generated more total revenue that Cooper, but O’Reilly did it with direct response ads, SMI says. Rachel Maddow’s show on MSNBC was the 10th most popular show during the 2016-17 upfront.
So far this year, national spending is up 1.8%, with cable up 3.6% and broadcast down 0.3%. Cable has accounted for 56% share of national ad dollars, with broadcast accounting for the other 44%.
Jon has been business editor of Broadcasting+Cable since 2010. He focuses on revenue-generating activities, including advertising and distribution, as well as executive intrigue and merger and acquisition activity. Just about any story is fair game, if a dollar sign can make its way into the article. Before B+C, Jon covered the industry for TVWeek, Cable World, Electronic Media, Advertising Age and The New York Post. A native New Yorker, Jon is hiding in plain sight in the suburbs of Chicago.

