Linear TV Ad Spending Down 5% in 2018-19, SMI Reports

The smarter way to stay on top of broadcasting and cable industry. Sign up below
You are now subscribed
Your newsletter sign-up was successful
Advertising spending on linear TV fell 5% to $44.2 billion during the 2018-19 television year, according to a new report from Standard Media Index.

In its review of the last broadcast year, SMI noted that the upfront accounted for just 49% of linear ad spending, dropping below 50% for the first time. Upfront spending at the 2018-19 upfronts was $21.5 billion.
In its report, SMI looked at two year compounded annual growth rates to even out the effects of the Olympics on TV spending.
Broadcast Prime (excluding sports) was the largest segment at $7.2 billion, but was down 3.4% on a two-year CAGR basis.
The cable entertainment networks maintained their market position with a marginal two-year CAGR decline of 0.7%. Their total day non-sports ad revenue was $11.7 billion.
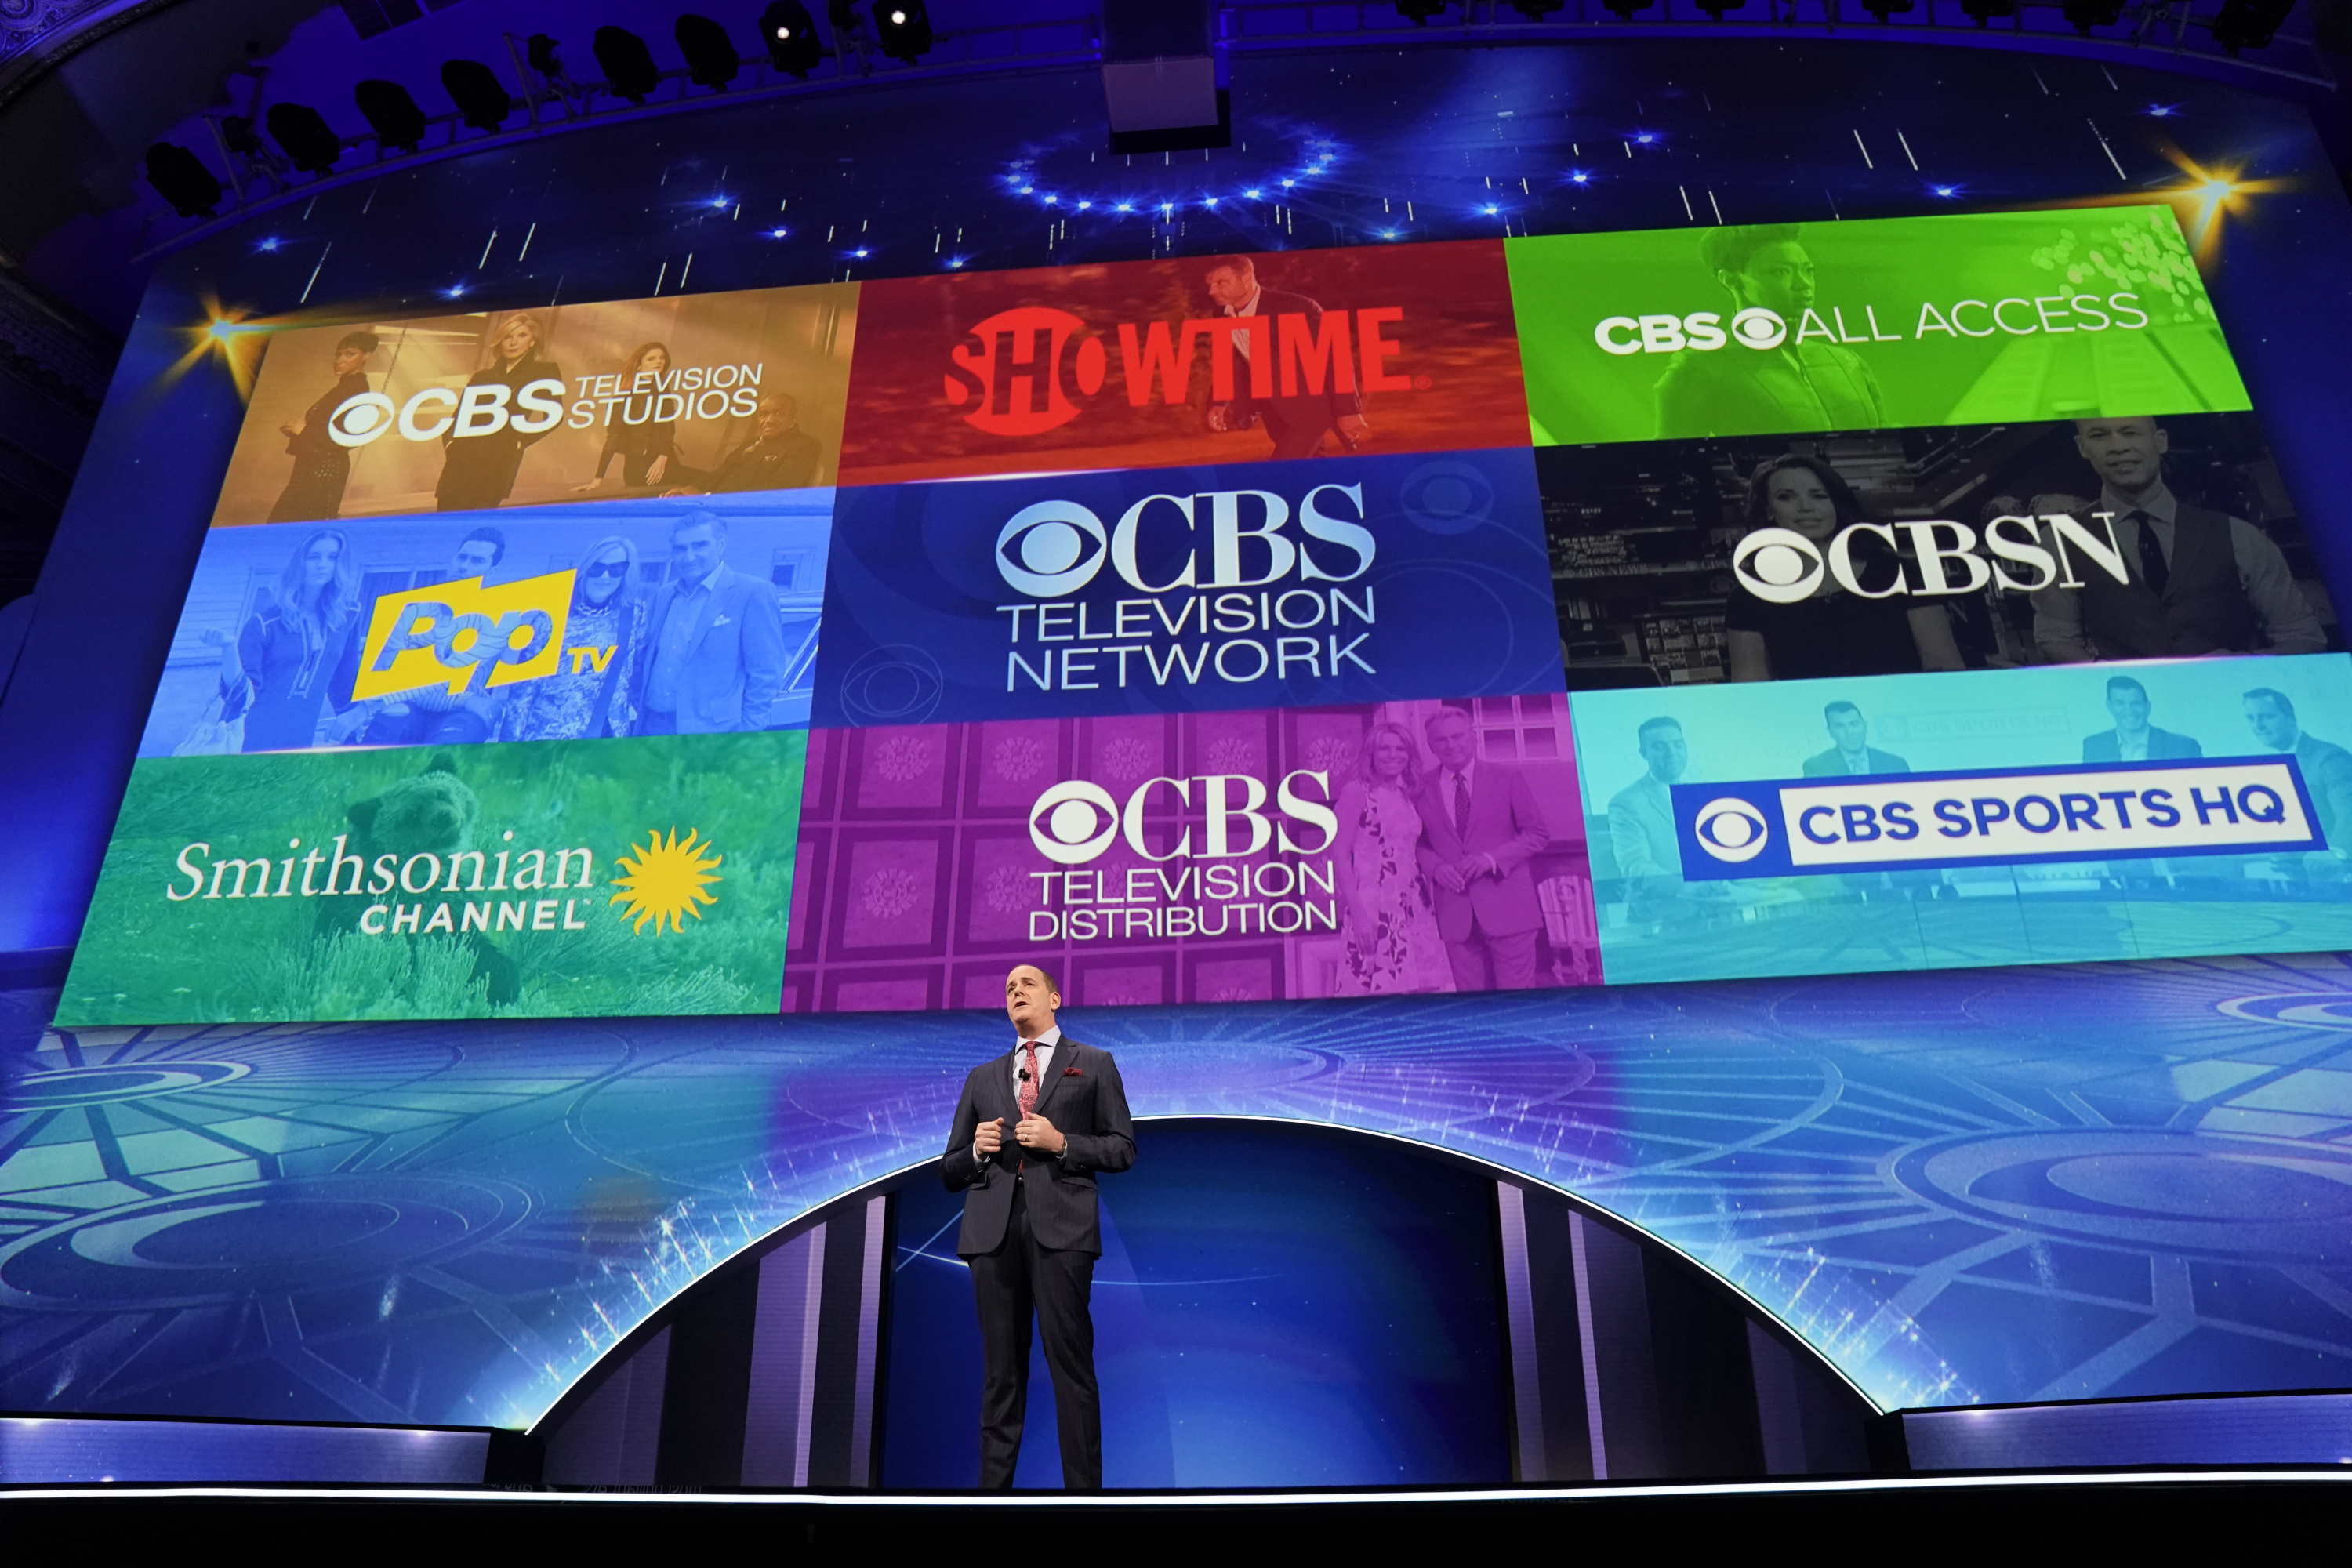
The newly combined ViacomCBS has the largest share of the linear ad market in 2018-19 with 20.1% of spending. ViacomCBS has the largest share of spending on entertainment programming (20.8%) and the largest share among kids (75.3%).
Comcast’s NBCUniversal was No. 2, with an 18.4% share. NBCU is tops in the news segments with a 32.2% share of spending.
The smarter way to stay on top of broadcasting and cable industry. Sign up below
The Walt Disney Co. was third with a 16.2% share overall and a league-leading 29.9 share in sports.
SMI said the top three media companies control a 55% share of linear ad spending.
Discovery had a 10.5% share of ad spending, followed by AT&T with 9.2%, Fox with 8.9% , A+E Networks with 3.8%, Univision with 2.7%, AMC Networks with 2.4%, Crown Family Media Networks 1.7% and ION with 1.4%.
Among individual networks, NBC was No. 1 in broadcast ad revenue, but was down 1.4% from the previous year. NBC was followed by ABC, down 3.5%’ CBS, down 1.7%, Fox down 6.3% and the CW, which showed a 3.4% increase.
With the size of the audience shrinking the average price of a prime time commercial dipped to $68,900 from $73,000 during first run comedy, drama and reality shows.

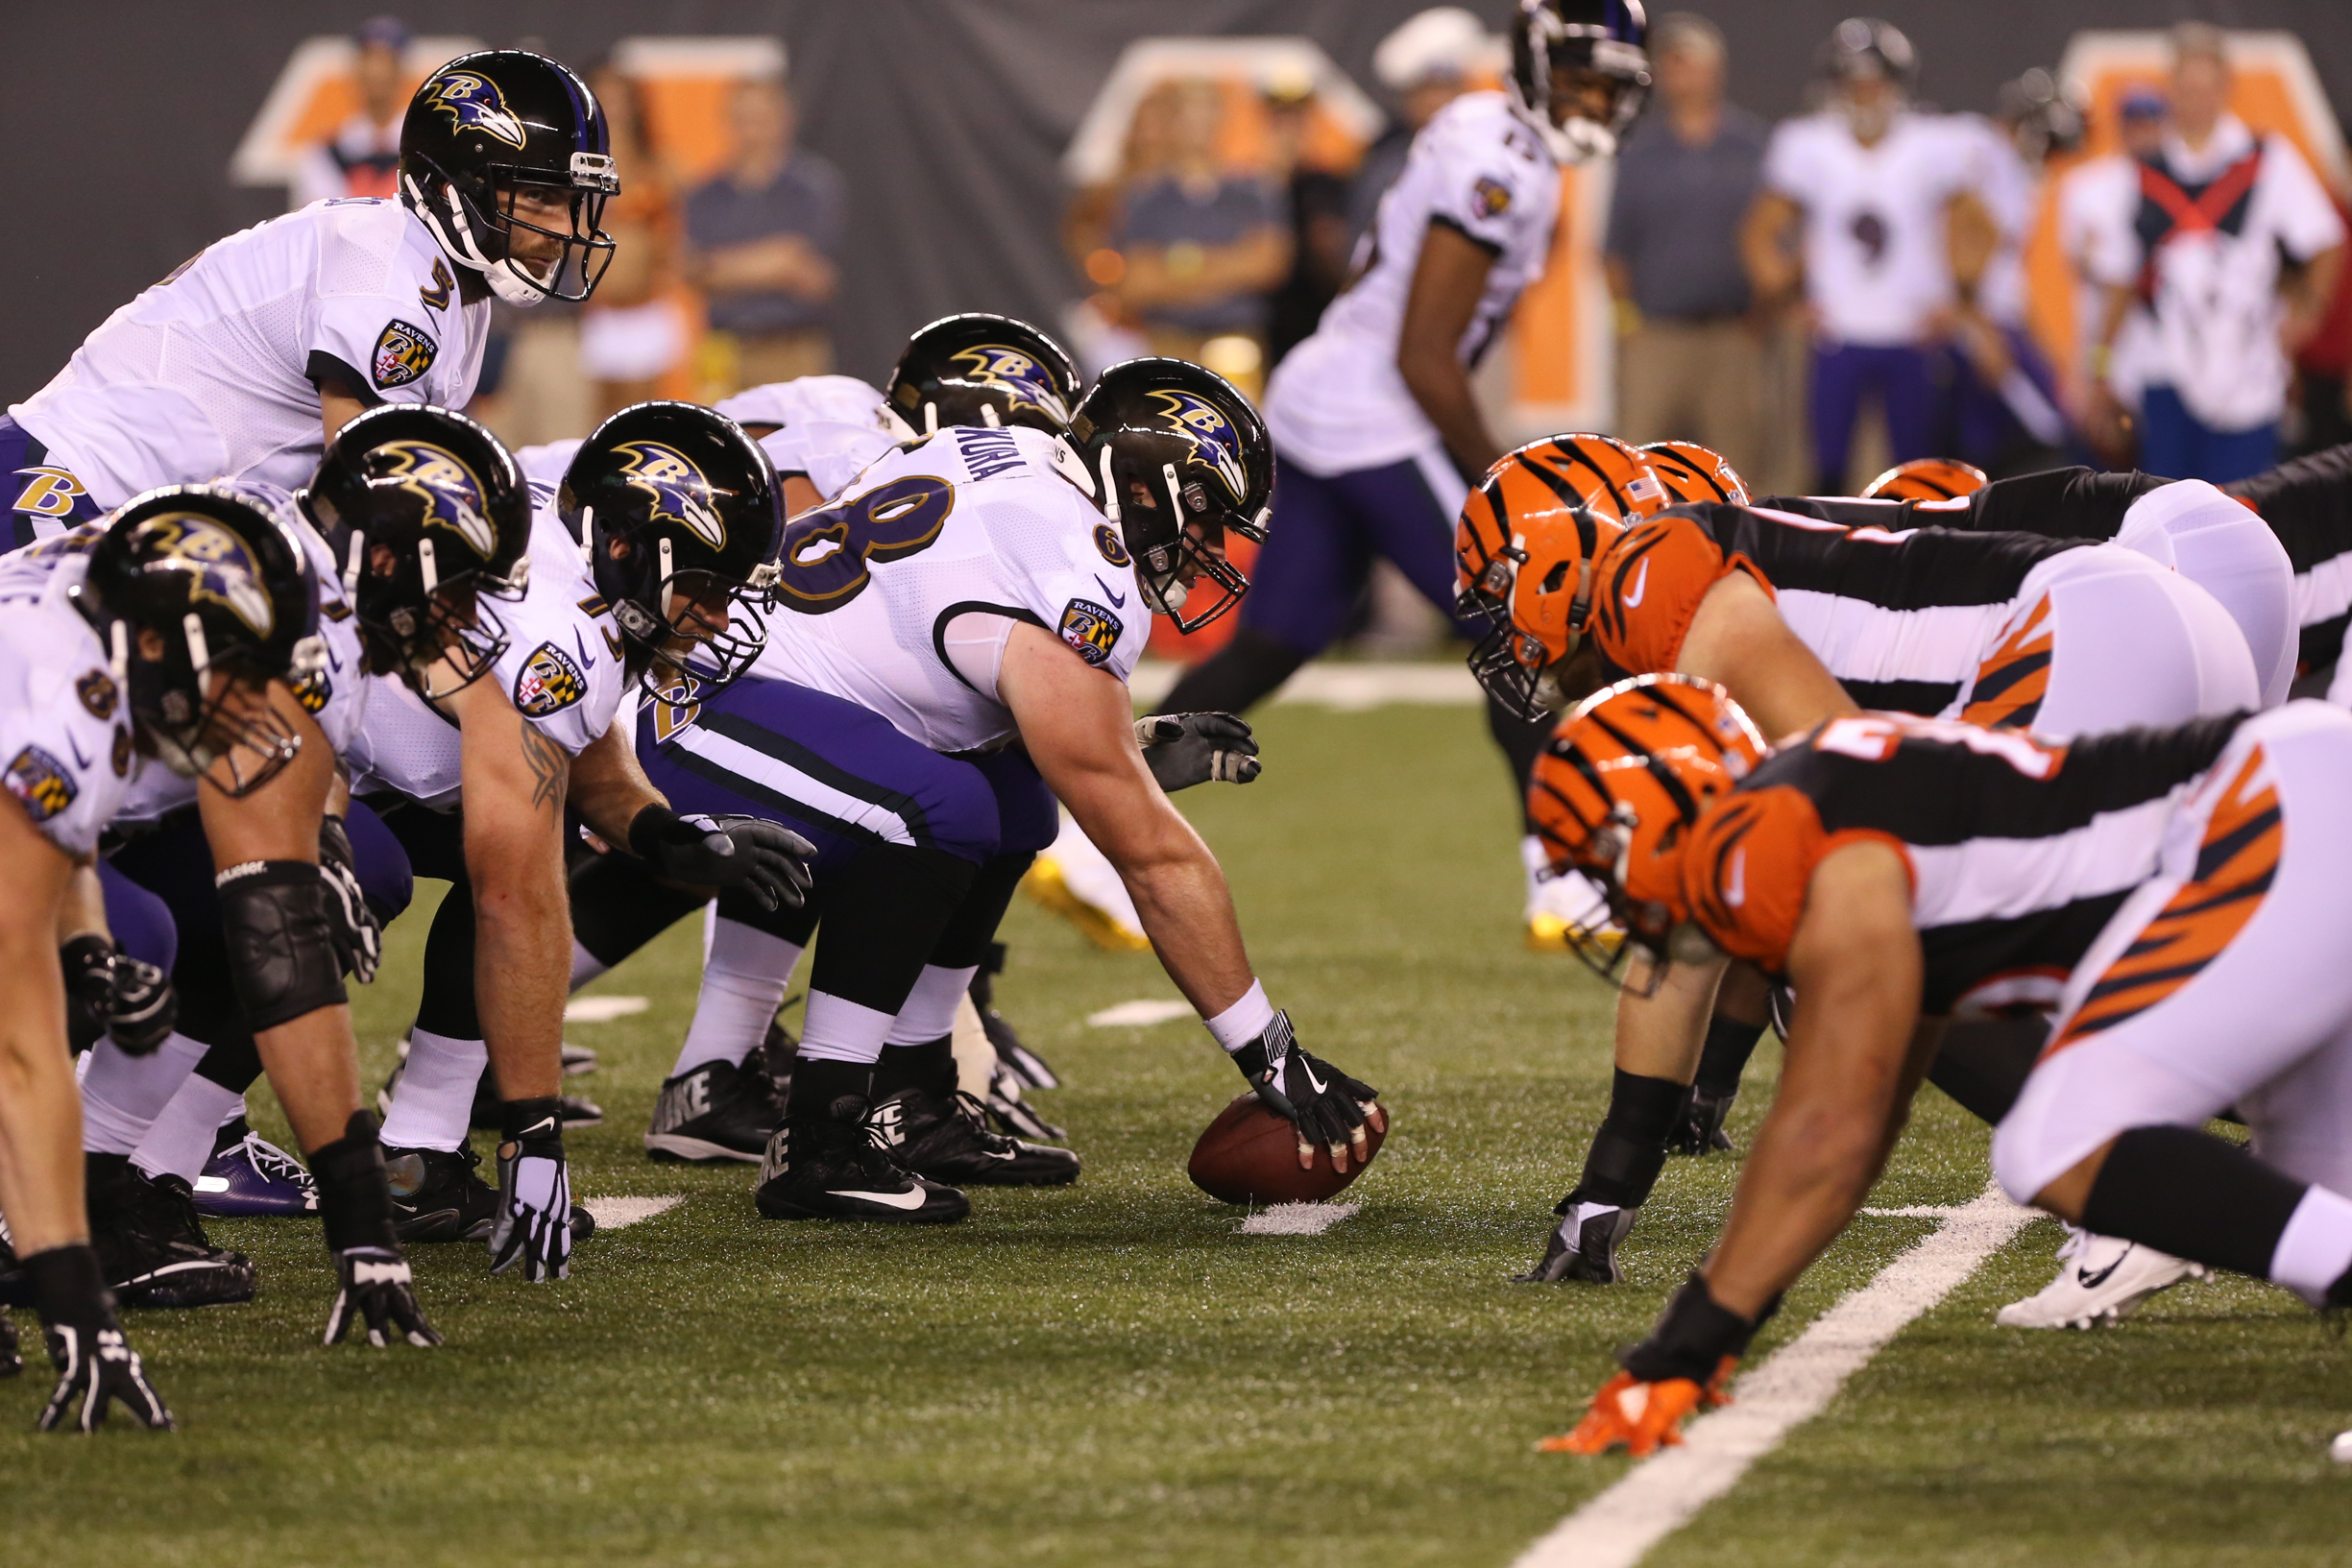
In sports, the most expensive commercials were for NFL football. Across all networks carrying NFL football, spots averaged $543,000. Commercials in baseball on Fox averaged $292,000, spots in NBA games on ABC averaged $190,000, baseball on ESPN averaged $109,000, NBA spots on TNT averaged $77,000, Major League Baseball spots on TBS averaged $72,000, Major League Baseball spots on FS1 Averaged $48,000, NBA spots on ESPN averaged $46,000 and NHL game spots on NBC averaged $46,000.
Comparing 2018-19 to 2016-17 to eliminate the effects of the February 2018 Olympics, HGTV generated the highest revenue among cable entertainment networks and was flat. TBS, which had been No. 1 in 2016-17, was down 3.8%.
Among the other top 10 cable entertainment networks in terms of ad revenue, Hallmark was up 13%, Ion was up 8.8% and Bravo was up 2.3%. AMC was down 7.2% and Discovery and USA were down 5.8%.
The three big cable news networks were down 4.5% to $1.7 billion but SMI noted that they’re up almost 70% since 2014-15.
Jon has been business editor of Broadcasting+Cable since 2010. He focuses on revenue-generating activities, including advertising and distribution, as well as executive intrigue and merger and acquisition activity. Just about any story is fair game, if a dollar sign can make its way into the article. Before B+C, Jon covered the industry for TVWeek, Cable World, Electronic Media, Advertising Age and The New York Post. A native New Yorker, Jon is hiding in plain sight in the suburbs of Chicago.

