Examining ‘The Good Doctor’: A Deep Dive Into Viewing Behavior for ABC’s Hit Drama

The smarter way to stay on top of broadcasting and cable industry. Sign up below
You are now subscribed
Your newsletter sign-up was successful
The numbers don’t lie about the Good Doctor - ratings are strong, fan support is vibrant on social media, and advertisers are getting great view on commercial breaks. But what else do we know about this hit? Using data from Inscape, the TV data company with glass-level information from 7.7 million smart TV screens and devices, a few things stand out.
OTT has ROI
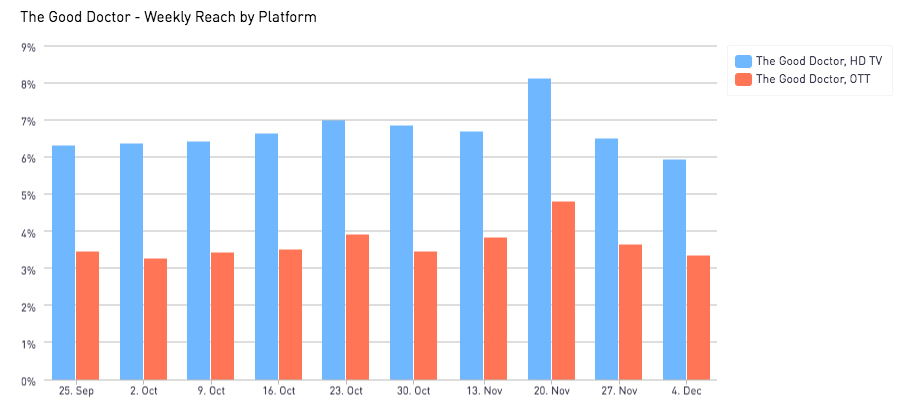
There’s been solid viewership so far in the first season, with the show premiering strong and largely maintaining its audience. While most people watch the show live, there’s a critical mass of OTT viewership as well.

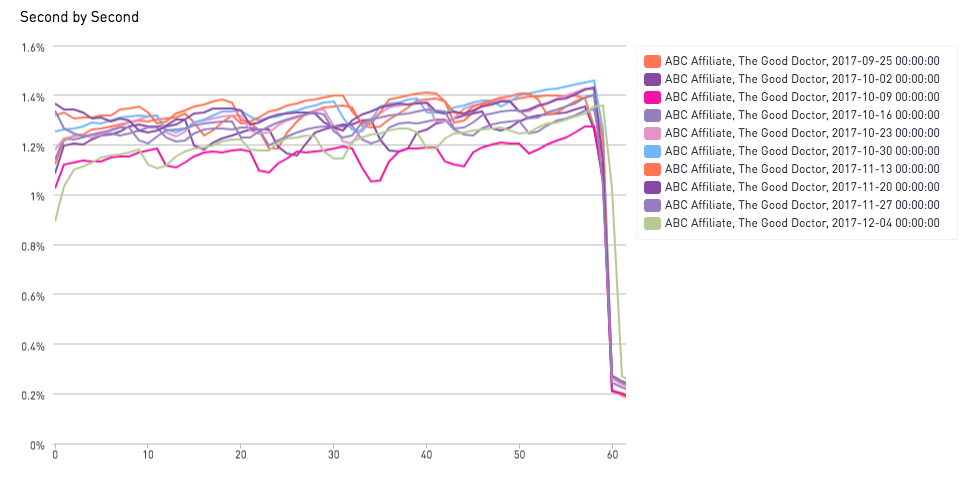
The second-by-second data provided by Inscape reveals that viewership is generally steady, with a slight uptick as each episode progresses — meaning once viewers tune in, they generally stay tuned in, which is always a good thing in this era of attention fragmentation.
The dips in the graph below are a reflection of when commercials aired; some viewers can’t help but briefly tune away from a show to see what else is on. The key is if they come back — and with The Good Doctor they do. Overall, fans are loyally watching each episode through to the end.

Inscape also has insight into other shows that The Good Doctor-viewing households are likely to watch. Topping the list: Kevin (Probably) Saves the World (ABC), Designated Survivor (ABC), Madam Secretary (CBS), Nightline (ABC) and Chicago Fire (NBC). Notably, Grey’s Anatomy, the long-standing ABC medical drama, is farther down on the list than you may expect, coming in at No. 19.
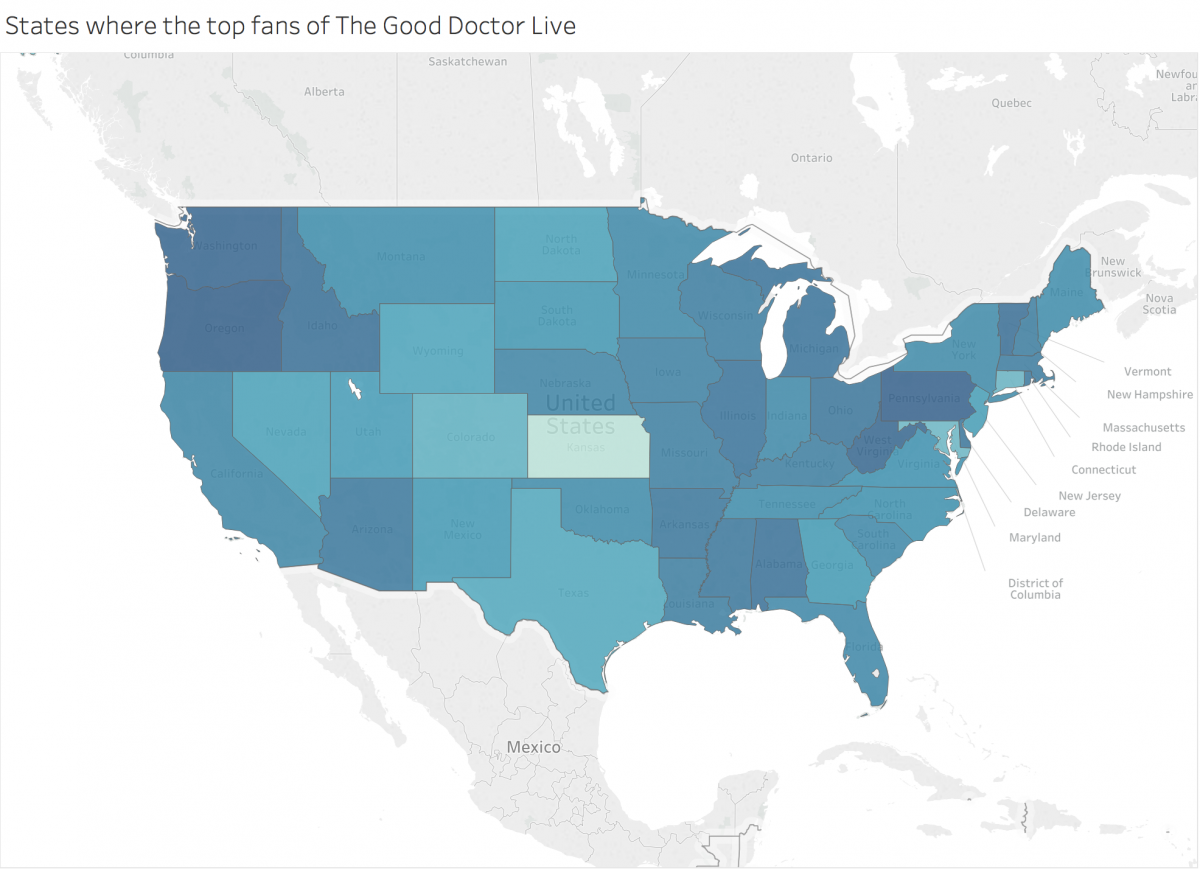
And finally, when it comes to the location of The Good Doctor fans, hotbeds include Vermont, Pennsylvania, West Virginia, Alabama, Illinois, Arizona and Oregon.
The smarter way to stay on top of broadcasting and cable industry. Sign up below

Population-normalized heat map of viewership. The darker the state, the more likely people are to watch.
