Bellevue- September 8th, 2017-- Since the dawn of TV advertising, brands have struggled to measure creative wear at a large-scale and consistent manner. Likewise brands cobbled together probabilistic models for understanding levels of interruption and the ability of creatives to keep attention. To solve these problems, iSpot.tv, the attention and conversion analytics company, today announced a first of its kind set of attention-based analytic products designed to let brands know exactly when and to what degree consumers start burning out of every ad on TV; and to measure performance of campaigns against an industry or brand average.
Using proprietary technologies and screen-level TV ad insights from millions of Smart TVs, iSpot.tv’s real-time attention analytics bring digital-like measurement to TV with the following new capabilities:
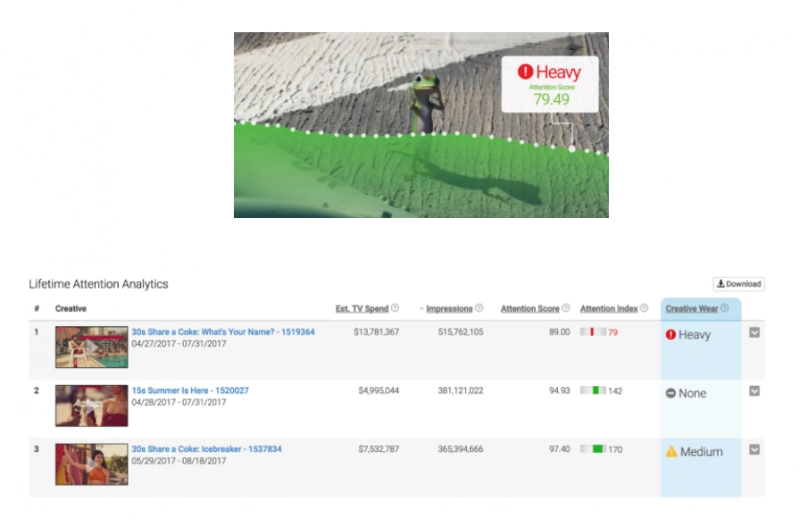
iSpot.tv’s Creative Wear solutiontracks the changes in attention score daily over the lifetime of an ad. As soon as the attention score start dropping, visual creative wear indicators show the degree of wear. With these indicators, brands know if and when consumers are tiring of an ad and can make changes before it’s too late.


Attention Score measures the duration of ad plays on TV screens, at scale. The scoring system is based the propensity and frequency of interruptions to a TV ad and represents the average viewing time of each ad. Viewer actions that reduce an attention score include changing the channel, pulling up the guide, fast-forwarding or turning off the TV. The measurement, a 1-100 scale is done at the creative, brand, industry, show and network level.
Attention Index offers brands the ability to quickly compare the performance of a TV ad or campaign against a multitude of factors, including competitor and industry performance. The index compares the relative interruptions to a creative or program placement, to the average Attention Score of an industry or brand. The average is represented by a score of 100, and the total index range is from 0 through 200. If attention index is 125, the ad has 25% fewer interruptions compared to the average.

Example: Automakers Aug 22-9/04, Chevy generate the most impressions but didn't hold anywhere near the attention Volkswagen did over the last two weeks
The company becomes the first to provide the industry with a reliable syndicated system for measuring and verifying TV ad plays on the TV screen across all formats and in near real-time.
