Chris McGrath, senior VP of data strategy and consumer intelligence for Viacom, has the same job as most everyone at the media giant—get more consumers to watch more Viacom content.
But his task is vastly different from the producers and marketers. And that task, and those of other Viacom data scientists of late, has been to make the science of Viacom content analytics more accessible and more easily understood for everyone else.
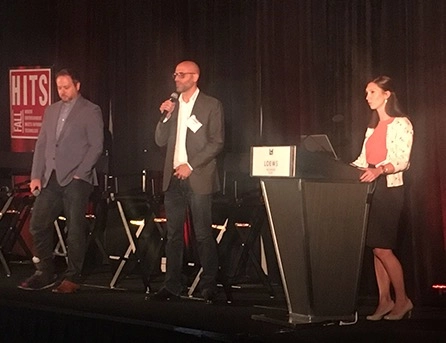
“As a data scientist, I couldn’t tell you the first thing about creating a show,” McGrath said, speaking Oct. 18 at the Hollywood IT Society’s Digipalooza Conference. “What I can do is get the data in the hands of the people who do.”

Until recently, doing that within Viacom was, in McGrath’s words, “frustrating.” Viacom executives and marketers would ask data teams for information to help make decisions about specific shows. The data teams would put their heads together, produce the information and present it. It’s a process that “was never-ending,” McGrath said, and it used to take two to five days for an analytics team to complete a request.
Now, thanks to the introduction of Viacom Audience Science, the data analytics experience for everyone involved is nearly immediate. Serving as one centralized data science platform with internal, informational apps built off of it, Viacom Audience Science is “data democratization” for the media company, according to Fabio Luzzi, VP of data science strategy for Viacom. It’s self-service, and puts the data and the data science itself in the hands of the decision-makers, allowing everyone who’s not a data scientist to run their own models, answering their questions around research, media planning, program optimization and marketing.
“We’re not trying to have the science replace the art. We’re trying to have the science inform the art,” said McGrath.
Amy Sinensky, director of data science, insights and strategy for Viacom, showed off the three apps that have served as the building blocks for the cloud-based platform: Quasar, Pathways and Affinity Maps.
Serving several different departments within Viacom, Quasar is Viacom’s tool for tune-in data, with built-in data science algorithms that allow those within the company to track demographics of any type. Who exactly is watching the program, how long did they tune in and what did they respond to? All of that can be accessed internally, using whichever variables a Viacom employee wants to include.
Pathways, true to its name, shows the path of TV engagement surrounding a program, sharing what people were watching before and after—including non-Viacom channels. It can be used to track up to 15 shows before and after the specific one selected. “[Pathways] is an easy visual, almost like a game,” Luzzi said.
Lastly, Affinity Map offers “everything from a bird’s eye view, showing connections between programs, potential niche audiences that could be better addressed and potential holes in programing” Luzzi said. “For instance, if a pattern emerges showing a lot of viewers clicking off Comedy Central for just a half-hour between programming, and going to the same non-Viacom site for other content, maybe it’s time to give them what they want to keep them from changing the channel. It’s the DNA of your audience, the landscape, and shows what you could be offering.”
And this is just the beginning for the platform: By 2017, a dozen similar apps could be built off Viacom Audience Science, and Luzzi wants to see the technology behind it made open-source. “We want to go beyond the content, get as much information as possible about the audience and then splice and dice the data,” he said.
