Ratings only tell part of the story of how well a TV show is resonating with viewers.
While ratings data gives a sense of how many people are tuning in, how do those shows make watchers feel from moment to moment? What’s the emotional temperature of the audience? Are they excited? Mad? Sad? Amused? Zoning out? You get the idea.
Social-media platforms such as Twitter and Facebook can help to fill out that picture as viewers post their views for the world to see. But there’s a lot of data out there to collect and analyze into a form that helps producers make better shows, as well as something extra that programmers can show to their advertisers.

A company that’s taken that challenge head-on is Canvs. Its high-level mission is to help partners understand how viewers feel about their shows.
It’s got a few bucks in the bank to help it expand and fulfill that mission. Last week, Canvs said it has raised a $5.6 million “A” round of funding led by KEC Ventures, with help from Rubicon Venture Capital, Gary Vaynerchuck and BRaVe Ventures, Social Starts, and Milestone Venture Partners. Those funds are tagged to fuel product development and growth.
Canvs uses data to illustrate “how fans are connecting with [a show] emotionally,” company co-founder and CEO Jared Feldman explained. “No one is measuring excitement.”
Social media has democratized how TV viewers express themselves, offering a “lens into society,” Feldman said.
Canvs, which uses Twitter data captured by Nielsen that’s relevant to TV programming, claims its platform can get a fix on the emotional responses and tone of the audience. It filters and sifts through data derived from how people actually “speak” on social media using expressions (WTF?, OMG!, “on fleek”) that don’t necessarily directly convey how a computer would determine if viewers loved or hated what’s happening during a show.
Canvs then maps those reactions to 56 emotion-based categories, such as love, dislike, annoying, beautiful and boring.
“It’s important that there’s data parity, and that we’re speaking the same language as the viewer,” he said. “We’re very millennials-focused.”
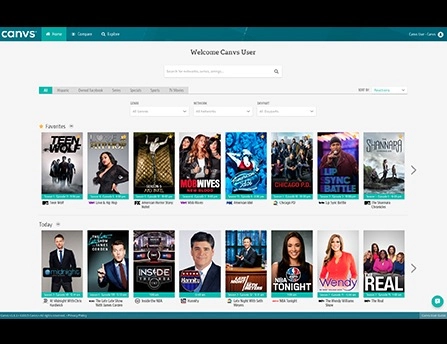
And Canvs pulls down and analyzes that information quickly and presents it in a Web-style dashboard that is updated daily, offering the kind of information that could be obtained via field surveys, but revealed in less time and for less cost — essentially accelerating the feedback loop.
“Relevance has a deadline,” Feldman said. “If you don’t understand [the data] right away, it doesn’t really matter.”
As the thinking goes, this kind of feedback is valuable for producers and writers as they maintain and tweak storylines based, for instance, on how characters are resonating with viewers, Feldman said.
The data has also been adept at predicting which shows would get renewed, Feldman said.
And there’s an advertising angle, under the belief that an audience that is emotionally charged is more likely to remember or be more receptive to spots that are stitched into a show.
“When fans emote about content, it means they are invested in it,” Feldman said.
While Nielsen and Twitter data is central to Canv’s system, it’s also starting to work with Facebook-owned channels.
Canvs is a subscription-based, syndicated platform that currently specializes in analyzing traditional first-run TV shows, within three hours or their airtime plus or minus. For instance, programmers can tap in to see how their shows stack up with competing shows on an emotional level.
The company will also expand into over-the-top video later this year, and eventually measure and monitor the emotional TV dial on a 24/7 basis, Feldman said.
“Live TV is super-important, but people are going to watch and talk about shows whenever they want,” he said.
Canvs, a company with about 25 employees, released the 1.0 version of its platform in December 2014.
Partners and customers include NBC Universal, Sony Pictures, Fox, HBO, Viacom, Creative Artists Agency and United Talent Agency, among others.
