Upfronts 2016: Nielsen Dismisses ‘Noise’ About Total Audience Delays

The smarter way to stay on top of broadcasting and cable industry. Sign up below
You are now subscribed
Your newsletter sign-up was successful
Related: Buyers Downplay Strong Scatter On Eve of Upfront
The initial delays in Nielsen’s Total Audience Measurement rollout are due in part to programmers needing to move deliberately during the current upfront season and are unrelated to technology, Nielsen executives said during a briefing of their cross-platform efforts.
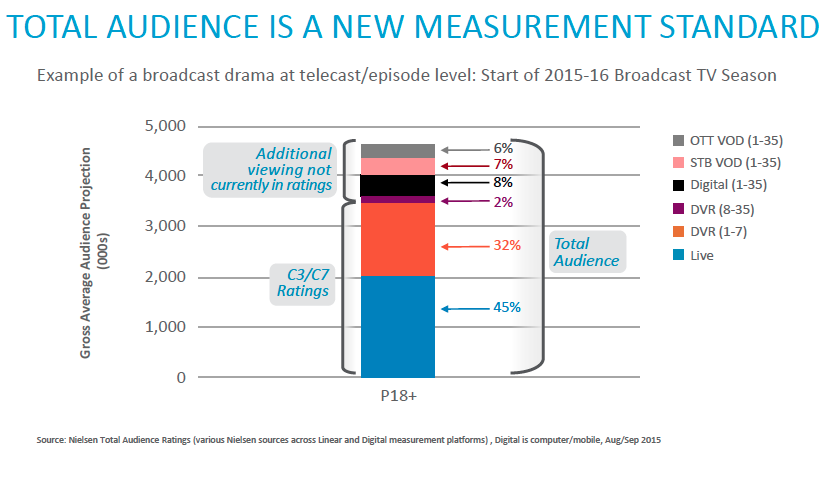
The comments came during a press session covering a pair of reports illustrating the shifts in viewing measured by Total Audience and a progress report on the industry’s engagement with Total Content Ratings. Using the example of an unidentified broadcast drama that aired last fall, Glenn Enoch, senior VP of audience insights, said that 23% of its viewing via DVR, digital and OTT had not previously been captured in Nielsen ratings. The genre of a show has a great bearing on its delayed-viewing lift, with animated comedy and sitcoms faring far better than unscripted, competition and serialized fare. Two primetime animated shows gained 52% and 58%, respectively, in the study, compared with 4% for a reality competition show.
Related: Univision Signs New Nielsen Ratings Deal
The reports used a selection of unidentified broadcast and cable shows that first aired last fall, capturing consumption by 18-49-year-olds from last Nov. 2 to March 6.
“There’s been some noise out in the marketplace around, ‘Is Total Content Ratings delayed? Is it on time? What’s going on?’” said Kelly Abcarian, senior VP of product leadership. “We work closely with our clients. They’ve asked us, through our client advisory boards, to be sensitive to the upfront season. They’re getting used to this data. They’re spending time with this data. They see extreme value in this data. They’ve done a number of internal things with the data in order to educate their broader sales teams. We don’t dictate how they use that data and how they position themselves heading into this upfront season.”
The patient rollout is “no different” from past changes of currency or metrics, she added. Programmers, who have had access to their own proprietary Nielsen cross-platform data since January, will start to see competitors’ data in the third quarter. In that same window, Abcarian said, access will be given to “the entire buy side of the equation,” i.e. agencies and media buyers, with transactions based on Total Audience currency still on track for the 2017 upfront.
The smarter way to stay on top of broadcasting and cable industry. Sign up below
Related: Analyst: comScore Moves No Threat to Nielsen
“There’s not any technology work being done around fixing or getting things ready,” she insisted. “That all got done at the end of last year.”
She pointed to one stat as a sign of networks’ embrace of Nielsen’s new tools. Six months ago, she said, about 30 networks had their VOD offerings measured. That number has risen to 55.
Nielsen, facing competition from the newly combined comScore and Rentrak, has been facing increasing scrutiny over its data. Some companies, especially cable players like Viacom and Turner whose networks have seen sharp ratings declines, have begun crafting their own bespoke cross-measurement systems that can offer a more optimistic snapshot.
Related: Videology Adds More Data From Nielsen to Platform
The bulk of the presentation and accompanying reports, offered a range of data points that confirmed how dramatically viewing is changing overall. One reason for that is the atomization of the traditional bundle. Execs noted that in addition to the 140 broadcast and cable networks, whose linear ratings are measured in the familiar fashion, there are now five unnamed MVPDs and three OTT networks (CBS All Access, Univision and UniMás) now contributing.

Other notable insights included:
- Audiences who viewed the sample programs live spent an average of 15 to 20 minutes watching them; when they watched on VOD, DVR or digital, the average viewing time was more than 30 minutes. “Live is a much more fluid thing,” Enoch said.
- The more overall lift a show gets, that lift comes increasingly from VOD rather than DVR.
- DVR viewing drops off markedly after 7 days. Only 7% of DVR viewing occurs after that period. “Catch-up” viewing beyond a week from original air tends to be via VOD or digital.
“By far, live TV is the No. 1 contributor to video consumption” overall, he emphasized. “DVR has grown over time, although we’ve seen less growth as DVR penetration has topped out at about 49%. But we’re just now getting to this VOD and digital piece.”
