Wimbledon Serves Ace for Watch-Time, GMA Scores Impressions Win: TV By the Numbers
With insights from iSpot.tv & Vizio’s Inscape

The smarter way to stay on top of broadcasting and cable industry. Sign up below
You are now subscribed
Your newsletter sign-up was successful
Below is a snapshot of TV by the numbers for the week of June 27-July 3, highlighting the most-watched shows and networks using glass-level data from Vizio’s Inscape, and network and show TV ad impressions insights via iSpot.tv.
Most-Watched Shows and Networks
Via Inscape, Vizio’s TV data product with glass-level insights from a panel of more than 19 million active and opted-in smart TVs. Data is linear, live TV only and includes all episode types (new and reruns). Rankings are by percent share duration (i.e., time spent watching).
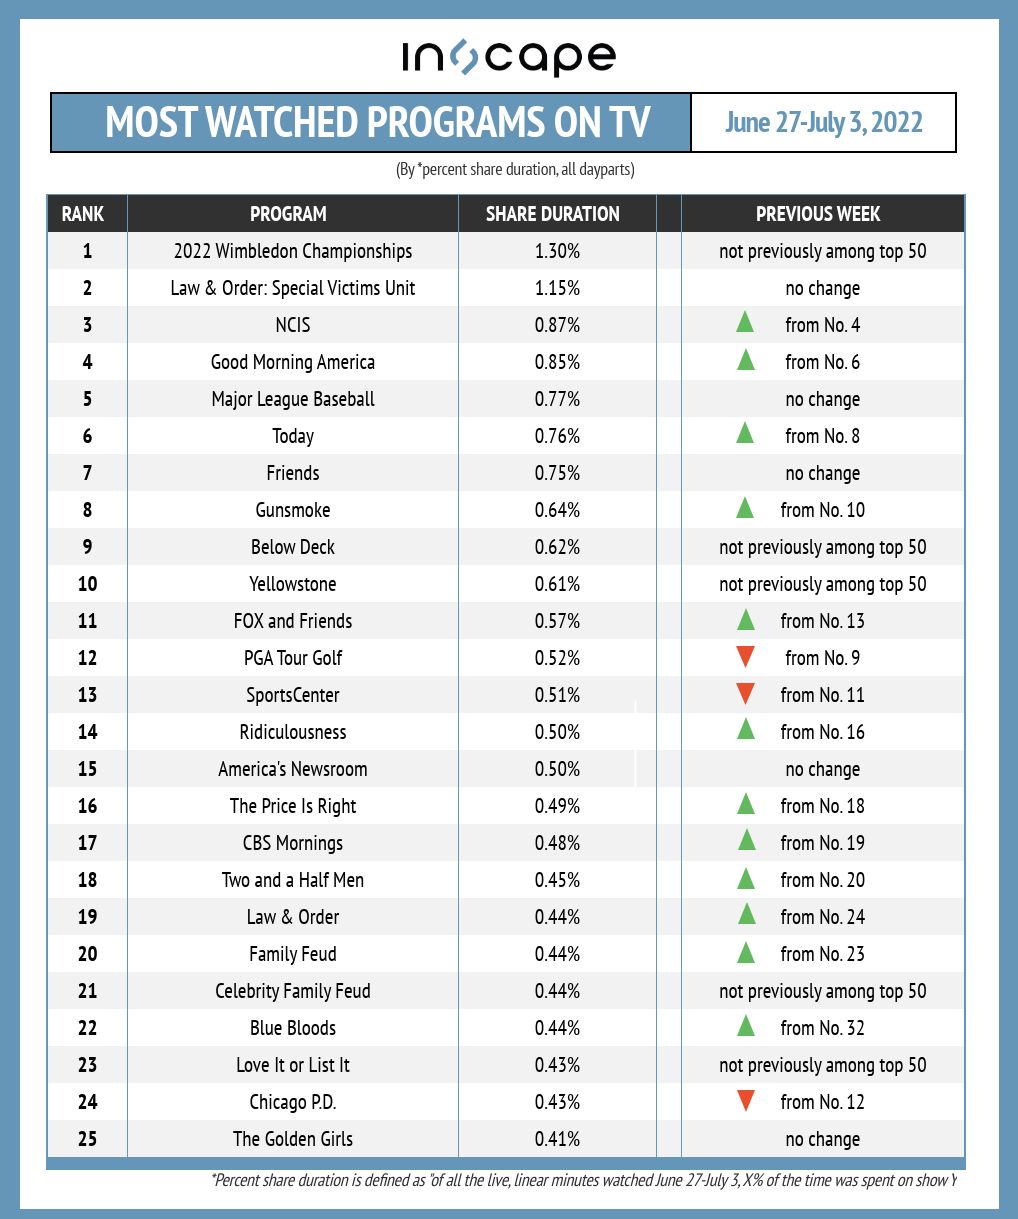
Wimbledon action drives a watch-time win for tennis, as the event soars to 1.30% of minutes watched with the tournament field narrowing. That’s No. 1 among all programs from June 27-July 3.
Some additional insights about the top programming on TV:
- Morning shows are on the rise week-over-week, with Good Morning America climbing from No. 6 to No. 4, Today moving from No. 8 to No. 6, and CBS Mornings progressing from No. 19 to No. 17.
- Marathons drive week-over-week newcomers in our ranking, with Below Deck soaring to No. 9 and Yellowstone jumping to No. 10 (after neither appeared among the top 50 the previous week).
- Feuding fuels more watch-time, as Family Feud hops from No. 23 to No. 20 week-over-week, while Celebrity Family Feud is new to our ranking at No. 21.
- On the week, six different procedurals appear among the 25 most-watched shows, with Blue Bloods notably hopping from No. 32 to No. 22.

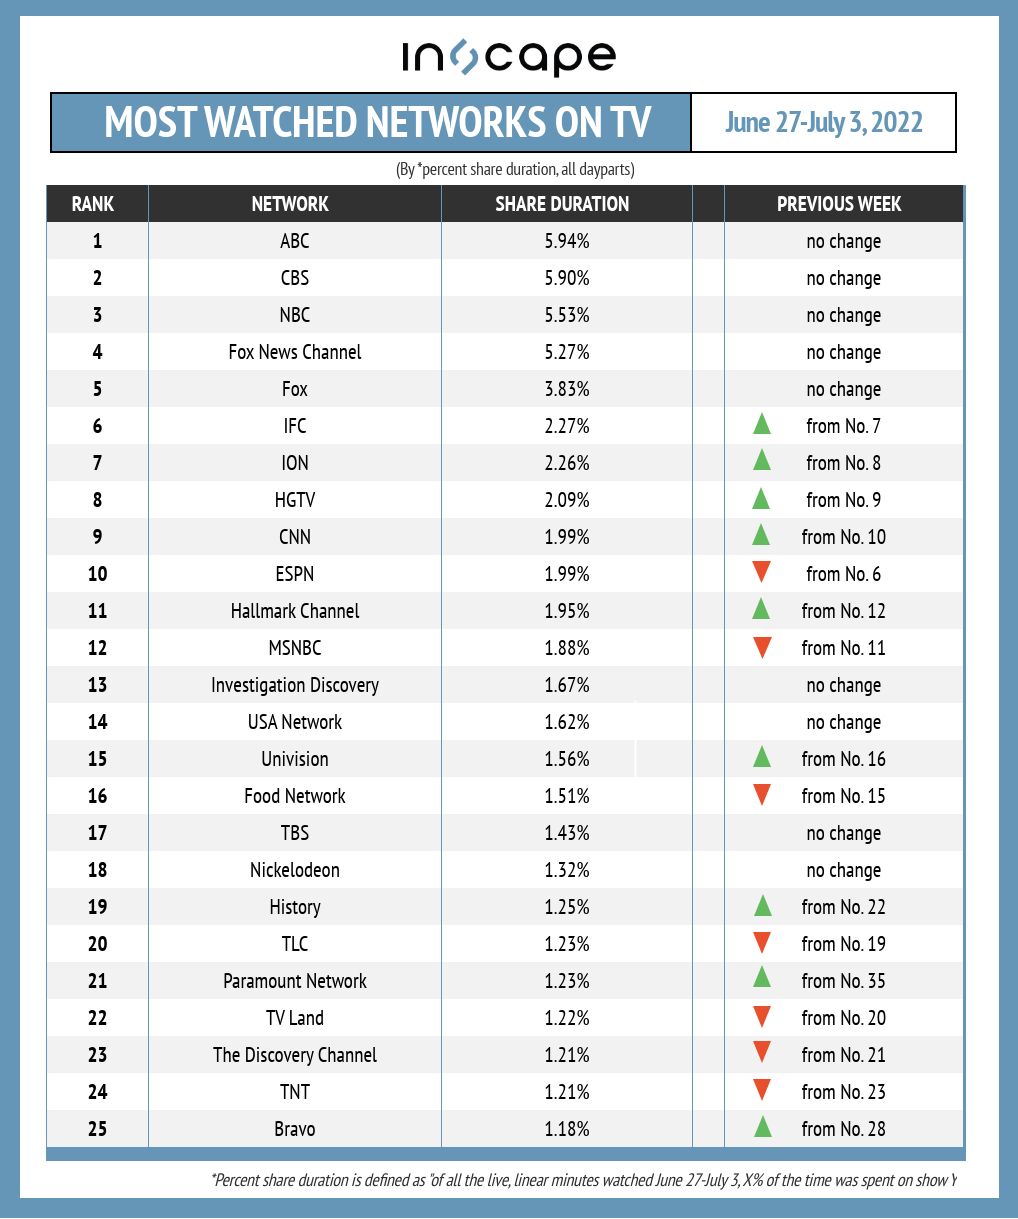
ABC stays atop our list of most-watched networks, with 5.94% of watch-time from June 27-July 3. That barely beats out CBS (5.90% of watch-time) for the No. 1 spot, as ABC benefits from its typical morning and daytime programming, plus Wimbledon.
Additional insights around the most-watched networks from June 27-July 3:
- Paramount Network leans into Yellowstone reruns to power a week-over-week jump from No. 35 to No. 21 in our ranking.
- Bravo’s own Below Deck marathon helps set up the network’s move from No. 28 to No. 25 by watch-time week-over-week.
- History drives from No. 22 to No. 19 by minutes watched week-over-week, due in part to coverage of the Barrett-Jackson Live Auction car event from Las Vegas.
- HGTV makes modest gains, jumping from No. 9 to No. 8 week-over-week, with a boost from new House Hunters episodes, plus a Love It Or List It marathon.

Top Shows and Networks by TV Ad Impressions
Via iSpot.tv, the always-on TV ad measurement and attribution company. Rankings are by TV ad impressions, for new episodes only.
The smarter way to stay on top of broadcasting and cable industry. Sign up below
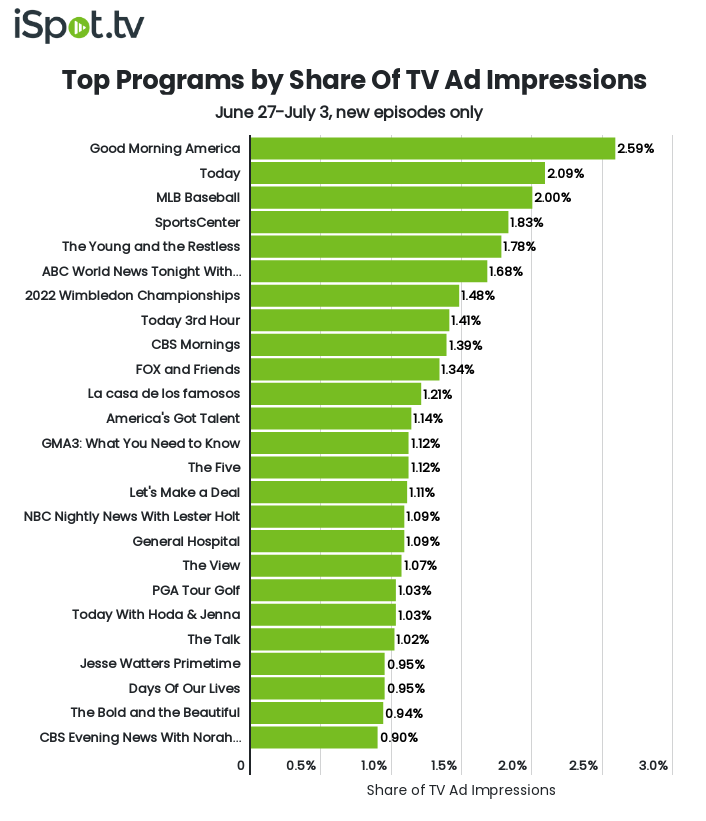
Good Morning America wakes up as the top program by TV ad impressions for the week of June 27-July 3, with 2.59% of the total. The show was No. 2 the week before, with 2.42% of impressions.
More data about the top programs by TV ad impressions:
- From June 27-July 3, five of the top 10 programs were morning shows, with Today’s third hour making the biggest jump – from 1.10% of impressions to 1.41% week-over-week.
- Wimbledon is a hit for impressions, as the tennis event scores 1.48% for the week across both ABC and ESPN.
- Telemundo’s La Casa de los Famosos soars from No. 27 to No. 11 week-over-week as advertisers flocked to week 8 of the popular reality show’s second season.
- This week’s ranking features four different daytime soap operas: The Young and the Restless (No. 5), General Hospital (No. 17), Days of Our Lives (No. 23) and The Bold and the Beautiful (No. 24).

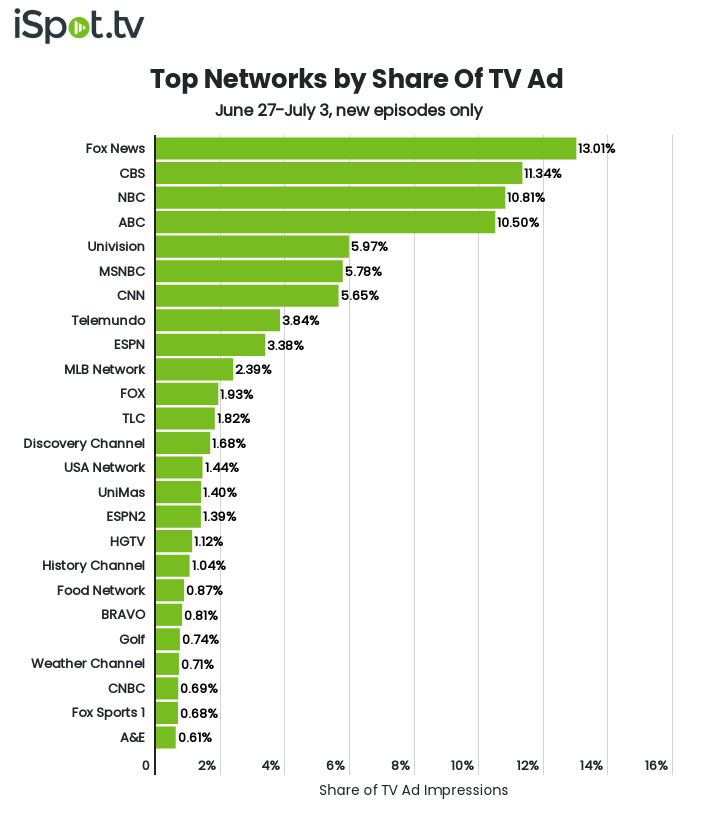
Fox News is No. 1 in our ad-impressions-by-network ranking, grabbing 13.0% of impressions. That’s up from 12.76% the previous week, when the cable network was No. 2 behind ABC.
Additional insights around the top networks by impressions:
- CBS increases from 10.53% to 11.34% of impressions week-over-week, thanks in large part to daytime programming, which accounts for 42.74% of the network’s impressions on the week.
- NBC moves from No. 4 to No. 3 week-over-week in our ranking, with Today and Today’s third hour combining for over 32% of the network’s weekly impressions.
- As baseball nears the All-Star Break, interest heats up for MLB Network, which increases share of impressions week-over-week from 1.88% to 2.39%.
- Ancient Aliens: Declassified delivers 21.57% of impressions for History Channel (No. 18 in our ranking), while the Barrett-Jackson Live Auction is No. 2 with 19.57%.

John Cassillo is an analyst and contributor with TV[R]EV.
