Weather Channel Watch-Time, Impressions Rise With Hurricane Ian: TV By the Numbers
With insights from iSpot.tv & Vizio's Inscape
The smarter way to stay on top of broadcasting and cable industry. Sign up below
You are now subscribed
Your newsletter sign-up was successful
Below is a snapshot of TV by the numbers for the week of Sept. 26-Oct. 2, highlighting the most-watched shows and networks using glass-level data from Vizio's Inscape, and network and show TV ad impressions insights via iSpot.tv.
Most-Watched Shows and Networks
Via Inscape, Vizio's TV data product with glass-level insights from a panel of more than 19 million active and opted-in smart TVs. Data is linear, live TV only and includes all episode types (new and reruns). Rankings are by percent share duration (i.e., time spent watching).
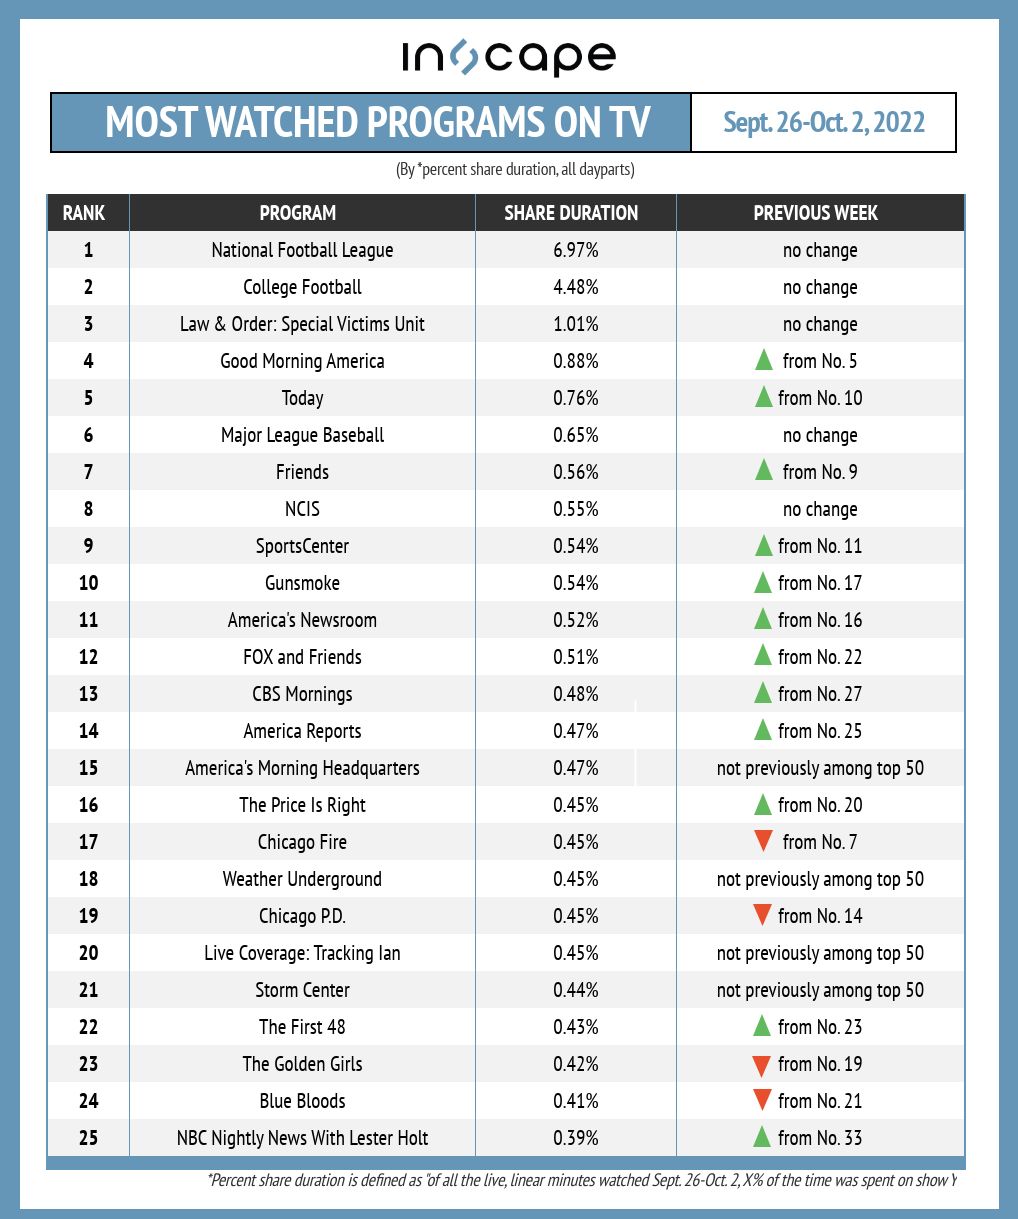
The NFL stayed atop our watch-time ranking for the fourth consecutive week. Week Four NFL action accounted for 6.97% of minutes watched from Sept. 26-Oct. 2, which is up from 6.49% the previous week.
Some additional insights about the top programming on TV:
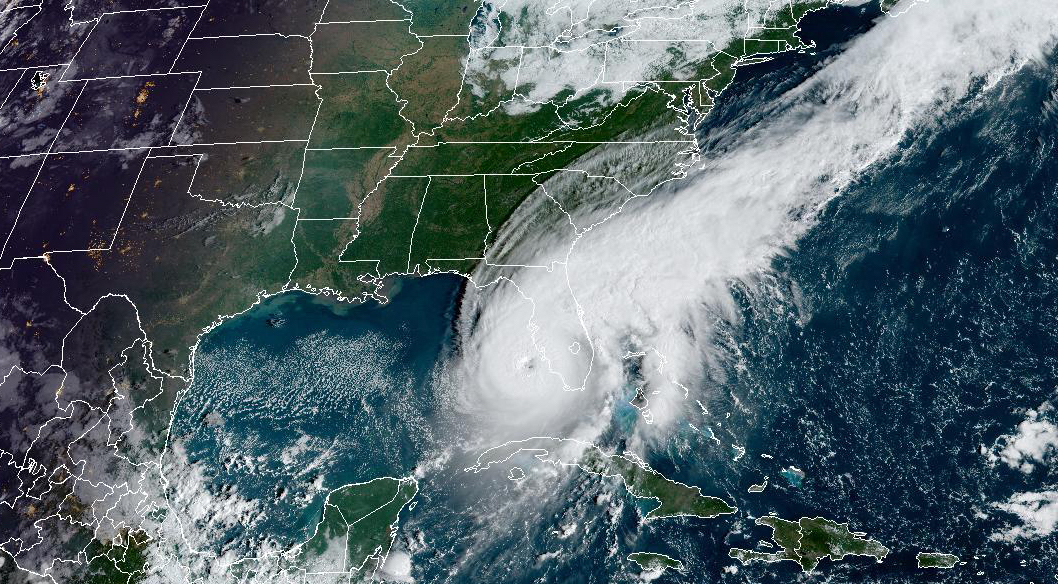
- With Hurricane Ian bearing down on the southeast U.S., audiences tuned into The Weather Channel coverage on shows including America’s Morning Headquarters (No. 15 by watch-time), Weather Underground (No. 18), Live Coverage: Tracking Ian (No. 20) and Storm Center (No. 21).
- Additional week-over-week newcomers to our ranking include CBS Mornings (climbing from No. 27 to No. 13 by minutes watched) and NBC Nightly News With Lester Holt (up from No. 33 to No. 25).
- Fox News programs Fox & Friends (from No. 22 to No. 12) and America Reports (from No. 25 to No. 14) also made sizable week-over-week jumps by watch-time.
- Western drama Gunsmoke returns to our top 10, jumping from No. 17 to No. 10 week-over-week.
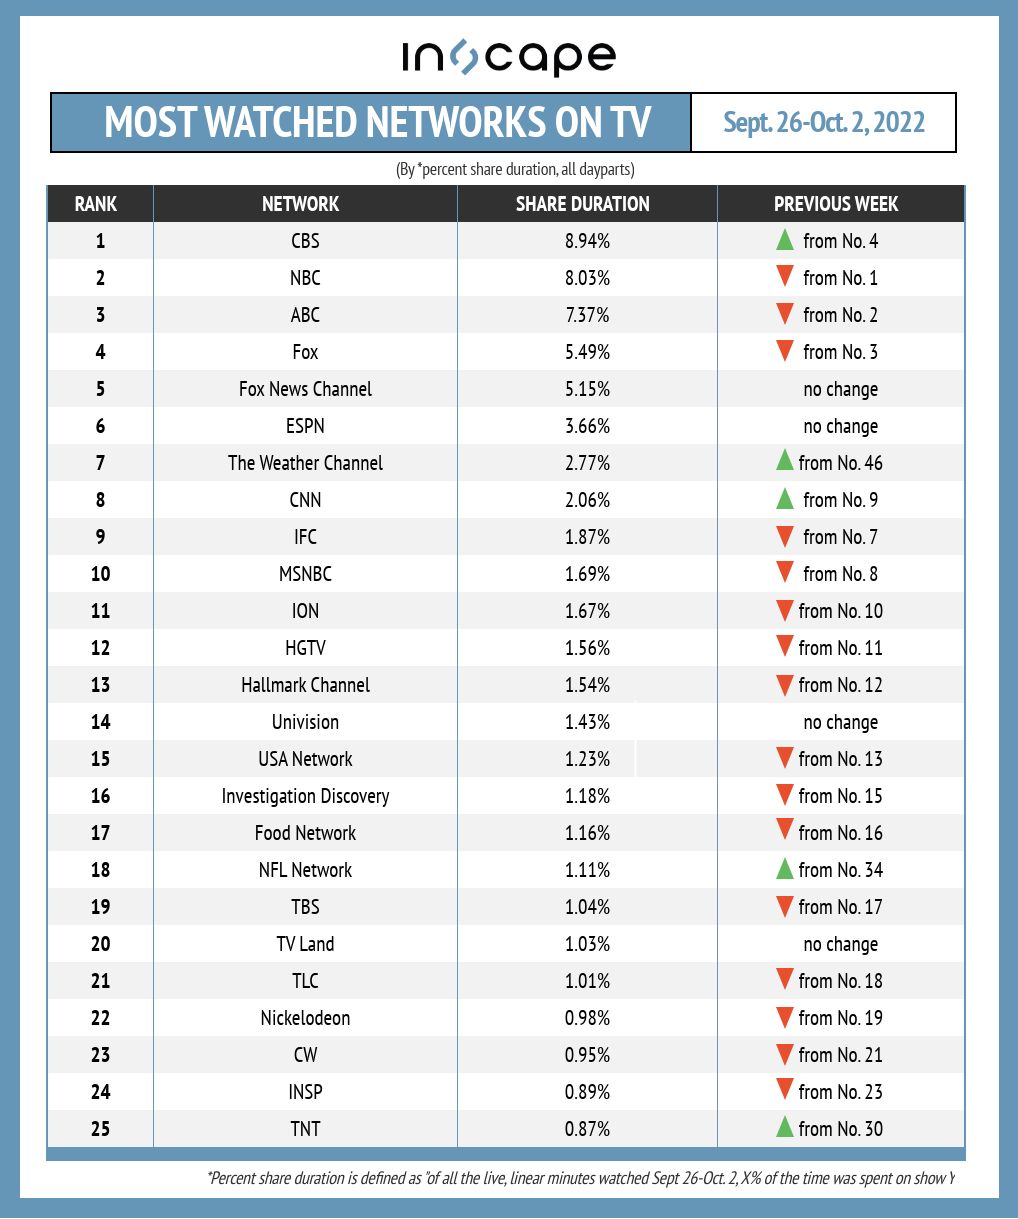
CBS hops from No. 4 to No. 1 week-over-week in our list of most-watched networks, thanks in large part to football. The NFL and college football accounted for over 31% of watch-time on the network, helping fuel a climb to 8.94% of minutes watched – up from 7.33% the previous week.
Additional insights around the most-watched networks from Sept. 26-Oct. 2:
- Hurricane Ian concerns created a surge in The Weather Channel viewership, as the network flies from No. 46 to No. 7 week-over-week.
- NFL interest is not just limited to the games themselves, as NFL Network hurdles up to No. 18 by watch-time on the week (from No. 34 the previous week).
- A Star Wars movie marathon helped power TNT’s rise from No. 30 to No. 25 week-over-week.
- CNN and Fox News both increased week-over-week watch-time, coinciding with more news interest overall.
Top Shows and Networks by TV Ad Impressions
Via iSpot.tv, the always-on TV ad measurement and attribution company. Rankings are by TV ad impressions, for new episodes only.
The smarter way to stay on top of broadcasting and cable industry. Sign up below
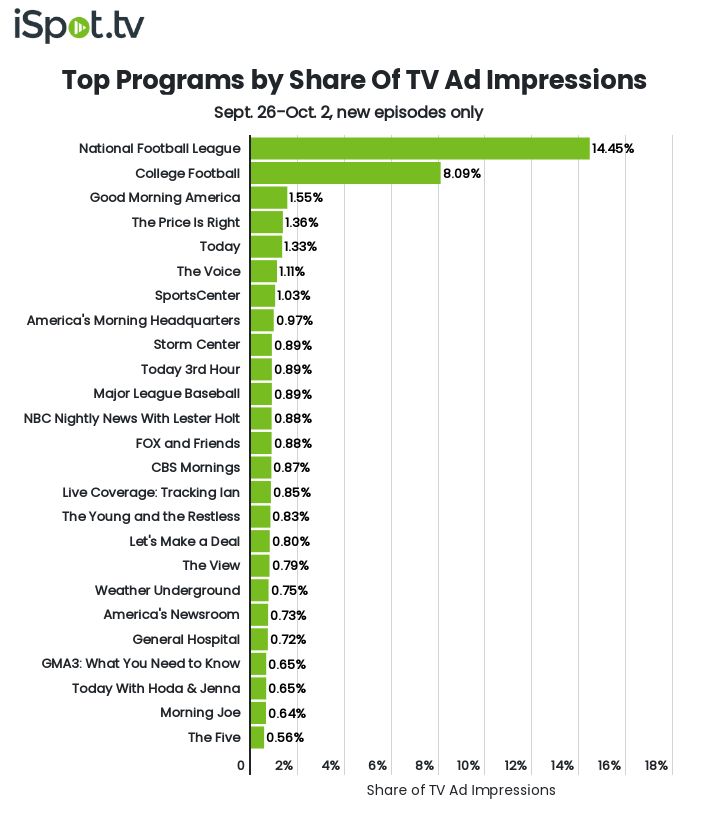
The NFL sits at No. 1 once again in our ranking, as live games delivered 14.4% of TV ad impressions. That’s up from 13.7% the previous week, as the league had just one Monday night game (vs. two overlapping contests the week before).
More insights about the top programs by TV ad impressions:
- Hurricane tracking means The Weather Channel programming pops up throughout our ranking – led by America’s Morning Headquarters at No. 8, then Storm Center (No. 9), Live Coverage: Tracking Ian (No. 15) and Weather Underground (No. 19).
- Overall, news- and talk-related programming account for 16 (nearly two-thirds) of the shows in our ranking, compared to 13 the previous week.
- Aside from the weather-related programs, CBS Mornings is one of the biggest week-over-week risers in our ranking, moving from No. 28 to No. 14.
- The Voice is the lone reality TV show in our ranking this week, staying at No. 6 in the early weeks of the new season.
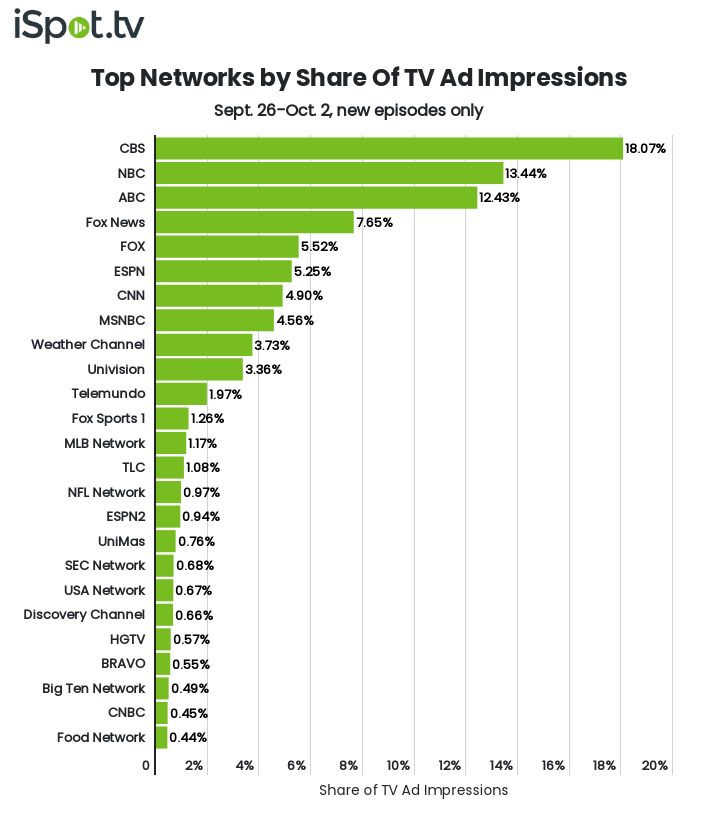
CBS benefits from the Sunday NFL doubleheader (which it typically alternates with Fox) to stay at No. 1 in our TV-ad-impressions-by-network ranking. The network had nearly 18.1% of TV ad impressions from Sept. 26-Oct. 2, up from 13.8% the previous week.
Additional insights around the top networks by impressions:
- The Weather Channel’s share of TV ad impressions climbed by nearly 4x week-over-week, from 1.00% to 3.73%.
- Cable sports networks continued to cash in on football and baseball action, led by ESPN (No. 6), then Fox Sports 1 (No. 12), MLB Network (No. 13), NFL Network (No. 15), ESPN2 (No. 16), SEC Network (No. 19) and Big Ten Network (No. 23).
- Speaking of, both the SEC Network and Big Ten Network are new week-over-week arrivals in our ranking, thanks in part to airing games with top teams – with Georgia appearing on the SEC Network and Ohio State landing on the Big Ten Network.
- NBC’s share of impressions climbed from 12.7% to 13.4% week-over-week, with news programs accounting for nearly a third of that total.
John Cassillo is an analyst and contributor with TV[R]EV.
