OTT Devices Hold Clear Advertising Advantage: Study
The smarter way to stay on top of the multichannel video marketplace. Sign up below.
You are now subscribed
Your newsletter sign-up was successful

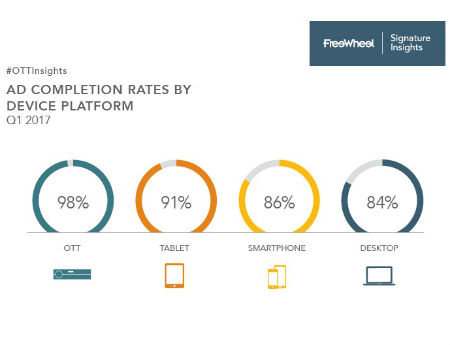
Viewers that use OTT devices are among the most highly engaged, and complete 98% of all video ads, while more than one-third of them spend an hour or more per network when they stream in, FreeWheel found in a new study: The Promise of OTT.
Ad-completion rates on other platforms aren’t too shabby, either: tablet (91%), smartphone (86%) and desktop/PC (84%).
FreeWheel, the Comcast-owned ad-tech company, also found that the majority, 69%, of OTT ad views also come from authenticated viewers – those that are pay TV subscribers who are using their credentials to log-in.
In backing up those numbers, FreeWheel observed that when viewers watch a clip or a live stream on an OTT device, “they are actively seeking out a specific series or network and tend watch it all: both content and commercials.”
FreeWheel also pointed out that many ad agencies often require the same standards for OTT as for desktop, even though the user experience is inherently different. Though video on OTT devices take up the full screen, most devices don’t allow multi-tasking, “making it all but impossible for an ad to not be fully viewable.”
For the Q1 2017 study, FreeWheel leaned on the Interactive Advertising Bureau’s definition of OTT – any device that can connect to a TV to deliver internet-based content, and a category that includes streaming players and sticks, smart TVs and gaming consoles. The study is based on a selected a sample of U.S. FreeWheel clients representing over 95% of OTT-driven digital ad impressions in the company’s research data set, which it also uses for its Video Monetization Report.
RELATED: OTT Devices Gobbling Up Ad View Share: FreeWheel
Per the study, 84% of ad views came by way of attached devices (those that are paired to a TV to stream digital content, such as an Apple TV box or Roku player), 11% from gaming consoles and 5% from smart TVs.
The smarter way to stay on top of the multichannel video marketplace. Sign up below.
FreeWheel also broke down ad view share by content format and device group:
-Attached devices: 52% full episodes, 43% live, 5% clips.
-Gaming consoles: 53% full episodes, 29% clips, 18% live.
-Smart TVs: 78% full episodes, 17% clips, 5% live.
