Infographic of The Week: Hub Entertainment Research Manages to Sum Up a Decade of Video Biz Change in a Single Chart
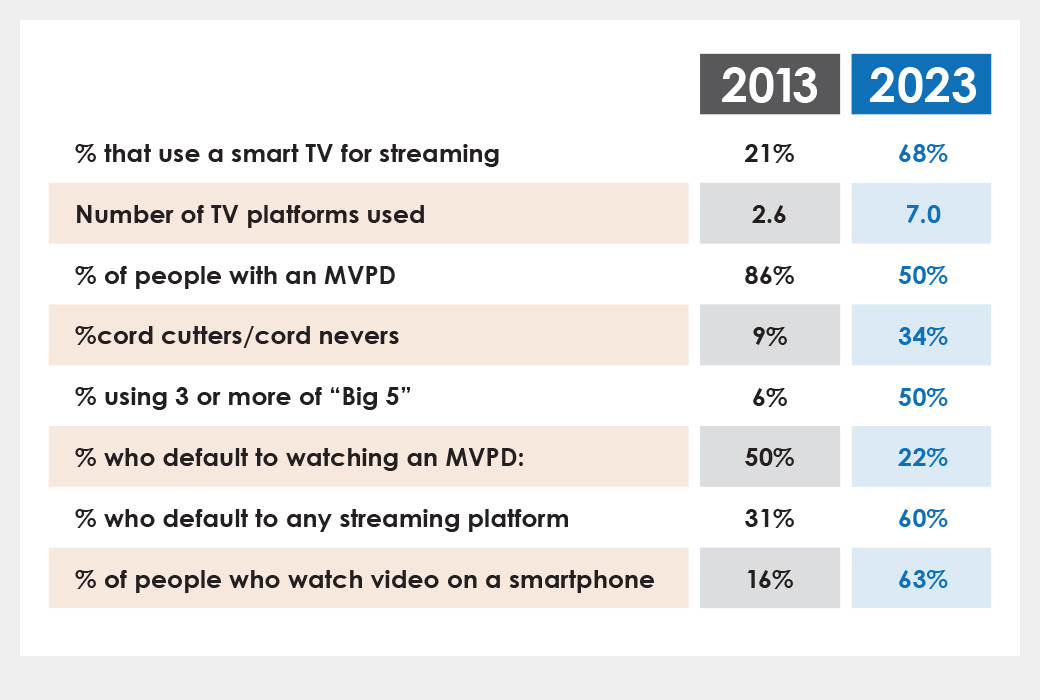
Back in 2013, 86% of Americans had pay TV at home and only 21% streamed video on their smart TV

The smarter way to stay on top of the streaming and OTT industry. Sign up below.
You are now subscribed
Your newsletter sign-up was successful
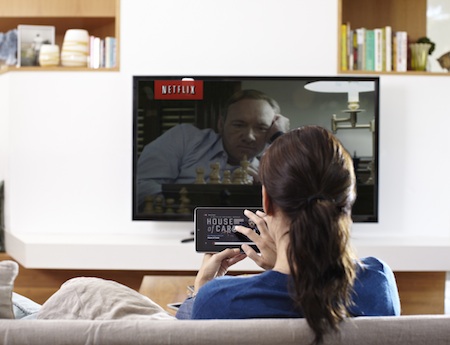
The average price of gasoline was $3.24. Marvel's Iron Man 3 was the No. 1 movie at the box office. One of the first made-for-streaming original series, House of Cards, debuted on Netflix. CBS' NCIS was TV's top scripted show. "Thrift Shop" from Macklemore & Ryan Lewis (featuring Wanz) was the No. 1 single.
Eighty-six percent of Americans had pay TV at home, and only 21% of U.S. consumers used a smart TV to stream video.
The year was 2013. And a lot of stuff has changed since then ... especially in the video business. Hub Entertainment Research, which was founded a decade ago, sums up the "then and now" quite nicely in this chart:
The smarter way to stay on top of the streaming and OTT industry. Sign up below.
Daniel Frankel is the managing editor of Next TV, an internet publishing vertical focused on the business of video streaming. A Los Angeles-based writer and editor who has covered the media and technology industries for more than two decades, Daniel has worked on staff for publications including E! Online, Electronic Media, Mediaweek, Variety, paidContent and GigaOm. You can start living a healthier life with greater wealth and prosperity by following Daniel on Twitter today!


