TV Everywhere Awareness Inches Higher: Study
The smarter way to stay on top of the multichannel video marketplace. Sign up below.
You are now subscribed
Your newsletter sign-up was successful

A new study from Digitalsmiths, the TiVo-owned maker of video search and recommendation services, offers a mix of good and bad news about adoption of authenticated TV Everywhere services – though increasing number of consumers are aware that these apps are available from their pay TV providers, a larger group remains unaware of them.
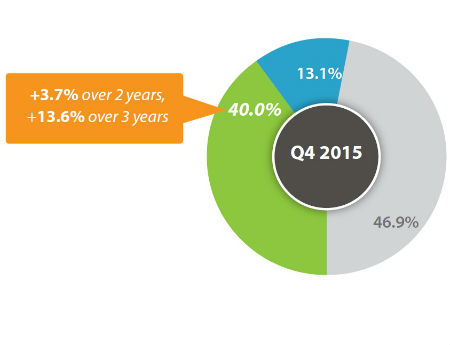
In a survey of more than 3,100 consumers, the company’s latest report – Q4 2015 Video Trends – found that 40% said they are aware that their pay TV provider offers TVE apps, up 3.7% in two years, and up 13.6% over a three-year span.
Still, 46.9% said they didn’t know if their provider offered such apps, an improvement from 55.2% in Digitalsmiths’s study from Q4 2012.
In Q4 2015, 21.5% said have a TVE app on their tablet or smartphone, a decline of 3.7% year-on-year. However, 45.4% said they use those apps on a weekly basis, up 3.6% from the previous quarter. Of those weekly TVE users, 21.6% tap in one to three days a week, and 14.7% access it six to seven days a week.
Just over half (50.8%) use the search and recommendation features offered on those apps, Digitalsmiths found.
Digitalsmiths said it believes “the next phase of TVE involves continued marketing efforts within each provider’s subscriber base, in order to improve overall adoption.”
Pay TV Churn Risk Remains High
The smarter way to stay on top of the multichannel video marketplace. Sign up below.
The study also took another look at the churn threat and found that 44.7% of those surveyed were at risk – meaning they answered “yes” or “maybe” when asked if they intended to change their cable or satellite provider in the next six months.
Of the group, 5.6% said they plan to cut service altogether, while 6.6% planned to change providers, and 2.4% expected to switch to an online app or rental service.
Among consumers surveyed who do not currently have a pay TV provider, 17.5% said they cut service within the past 12 months, down from 19.3% from the previous quarter (Q3 2015). Additionally, 45.5% of the group without pay TV service said they use an antenna to access TV channels over-the-air.
There was also a slight uptick in the percentage of respondents (77.4%) who said they were satisfied or very satisfied with their pay TV service, with higher fees for video service, increased fees for Internet service, and poor customer service as the top three reasons for dissatisfaction.
Indicating that consumers remain interested in new, slimmer bundles and a la carte options, 73.6% said they’d like to choose only they channels they want to watch, a number that actually dropped from 81.6% in Digitalsmith’s Q1 2015 study.
The top 10 most-desired channels among respondents were: Discovery Channel, ABC, CBS, History, NBC, A&E, Nat Geo, Fox, HBO, and PBS. The bottom five: Fusion, Tennis Channel, Univision, Ovation TV and Telemundo.
Turning to OTT, 55.4% of those surveyed said they have a monthly subscription to an OTT service, down slightly from the previous quarter.
Of the group that are cord-cutters or cord-nevers, 59.1% use a monthly subscription service, with Netflix (53.0%) and Hulu (13.4%) the top OTT services used by those non-pay TV subs.
With most OTT and SVOD services offering personalized or next-gen interfaces, Digitalsmiths, for the first time, used the study to understand consumer sentiment toward Netflix features. Roughly 54.3% said the ability to create personal profiles was a key feature, as well as auto-play (47.2%), recommendations based on viewing history (43%). However, price (64.6%) was the top feature ranked.
